

Along the narrow roads in the rural hinterlands of Mysore district, one sees large banners lining the streets. The symbols of various political parties, split between the Indian National Congress , the Bharatiya Janata Party and the state’s Janata Dal (Secular), loom large as the figures of their respective candidates for the forthcoming Karnataka Assembly Elections greet passersby with reverentially folded hands and a large smile.
140 kilometers away, in the state’s capital Bengaluru is where Karnataka meets the world, as it were, for it is this city that birthed India’s position as a global leader in software development, earning for itself the moniker of the Silicon Valley of India. Karnataka is amongst the regions with the highest FDIs in the country and in 2022, Bengaluru’s startup ecosystem saw a funding of about 10.8 billion dollars with 22 companies going on to become unicorn entities, that is, with a valuation of over one billion dollars.
Given that Karnataka is a state with a global significance, a glimpse into the backgrounds of its policymakers is an interesting endeavor, particularly what their educational qualifications are and what it is that they do apart from being politicians.
A decade in review: the Karnataka legislative assemblies of the 2010s
Where are the women?
To begin with, both elections in the 2010s in Karnataka––the 9th assembly election in 2013 and the 10th in 2018—saw only 7 and 8 women elected to office respectively, making Karnataka’s gender representation in the Vidhan Sabha dismal, hovering around just 3%.
Of the 7 women legislators elected to office in 2013, only one—the actor and politician Umashree—was a graduate and had a postgraduate degree. Of the remaining legislators, two had studied up to class 12, while three had only passed the 10th standard, indicating that in the 9th assembly, the majority of Karnataka’s women legislators held only school level education.
The subsequent election in 2018, where the BJP had a majority, ushered in 8 women legislators into office, just one more than the previous year, and saw a rise in candidates with a graduate degree—with all four being post-graduates—even as an equal number of legislators lay at the other end of the spectrum with only school-level education. While these figures point to an increase in the qualification levels of women legislators, it is not conclusive, and the fact that women have constituted barely 3% of the state’s assembly over the past two elections must not be ignored.
Education
The Karnataka legislature has 224 members. In 2013, the data indicates that of these, 58% were graduates. However, it is imperative to delve into the nuances of these figures. It must be noted that the number of MLAs in the graduate, graduate professional, and postgraduate categories together constitute 58% of the legislative assembly. But if one were to look at the number of graduate degree holders and the number of graduate professionals in isolation, we observe that the number of MLAs who have only studied till class 12—numbering 41—is not far behind the number of MLAs who have a graduate or graduate professional degree, numbering 58 and 52 respectively, and that legislators who have only studied until the 10th standard constitute just as much as post-graduate legislators numbering 22 and 21 each.
This indicates that the proportion of MLAs whose qualifications do not cross higher secondary education is independently comparable to the number of MLAs who are graduates, graduate professionals, or post-graduates.
Further, there are five MLAs who have only studied until the 5th standard and nine MLAs who have not studied beyond the 8th standard. Therefore, cumulatively, in 2013, 34% of Karnataka’s legislators had only school leaving certificates.
What changed in 2018?
From the data, we surmise that not much changed in the educational demographics of Karnataka’s politicians over the past five years, regardless of which party was in power. While in 2013, in the government helmed by the Congress, cumulatively 34% legislators had only school leaving certificates and 58% were graduates, in the 2018 elections steered by the incumbent BJP government, a cumulative 35% of the state’s MLAs continue to hold only school leaving certificates and similar to the previous assembly, 59% held graduate degrees.
In this vein, a party-wise analysis of the educational backgrounds of MLAs will prove insightful.

In 2013, the Congress had an absolute majority, winning 122 of 224 seats. Of these, 62% of the winning MLAs were graduates—with 15 holding post-graduate degrees—while 31% had only school-level education, comprising twenty five legislators who had studied up until standard 12, eight having passed standard 10, five having studied till standard 8, and one MLA who had only completed primary school education until standard 5.
Coming to the BJP, of the 40 elected members in 2013, we see that 50% of the party’s legislators were graduates, while 42% had only school education. It must be highlighted, however, that though the BJP had a smaller number of elected members in comparison to the Congress, the proportion of its winning candidates who had completed only the 10th standard (17.5%) was higher than the Congress party’s, which stood at 6%. The JDS, which in 2013 had the same number of elected members as the BJP, also had the same proportion of graduates as the BJP. However, at 37.5%, it had a lesser number of legislators with just school-level education than the Bharatiya Janata Party, making the BJP the party with the highest proportion of legislators with just high-school education relative to other parties in 2013.
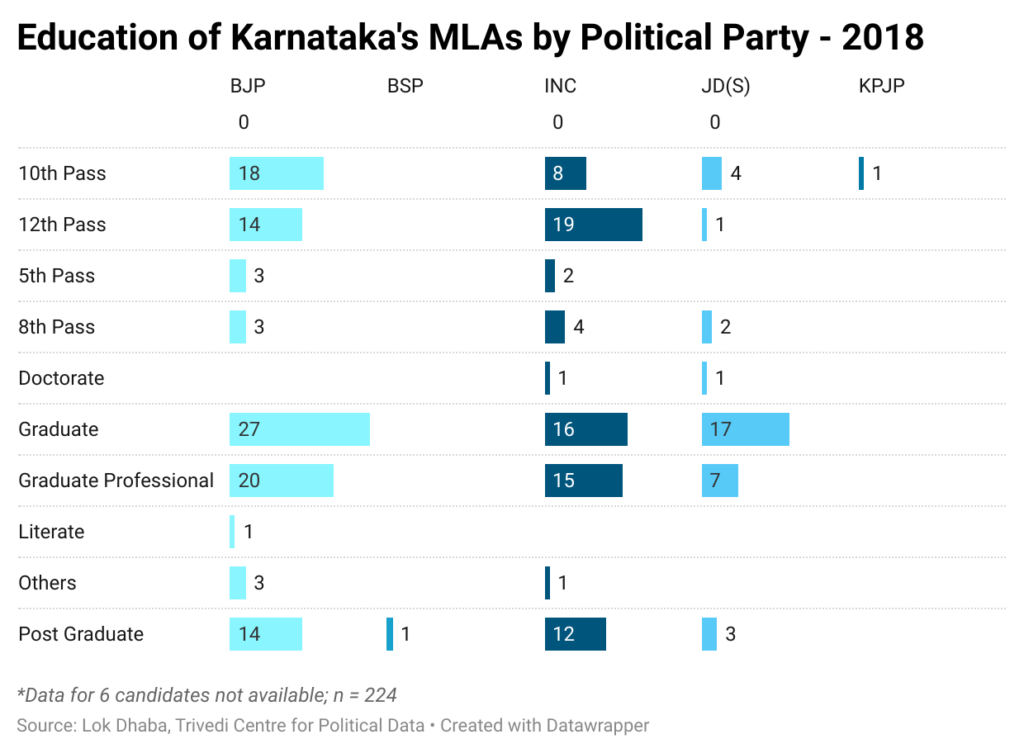
In the following election in 2018, the incumbent BJP commanded a majority, winning 102 seats, whereas the Congress’s seat share dropped to 80. Of the 102 elected BJP members, 60% were graduates, while 37% had only attended school with one MLA being just literate with no formal school education. As for the Congress, it saw a drop in its proportion of graduates by 7% in comparison to its previous cohort where 62% MLAs had attained higher education. In addition, the proportion of legislators who had only attained school-level education went up by 10% accounting for nearly 41% of the Congress party’s MLAs. However, the trend remains that the proportion of BJP legislators who had studied only till standard 10 is higher than that of the Congress party’s in this assembly too—the figure being 17% for the BJP and 10% for the Congress. Furthermore, the BJP, which, in the 2013 elections had no winning candidates with only a primary education background added three legislators in 2018 who had only studied till class 5 and three who had finished middle school whereas in the previous election it had only one candidate who had studied until class 8.
Coming to the JDS, some interesting trends arise. In 2018, it had the highest proportion of legislators in comparison to the Congress and the BJP with graduate degrees, accounting for 75% of its winning members. Furthermore, in absolute terms, it has more MLAs in the graduate category—numbering 17—than the Congress, which has 16 MLAs with an undergraduate degree but double the seat share of the JDS.
Boiling down to the trends
In the 2010s, we see that the Congress has had the most number of legislators with a postgraduate degree—27 in all—with numbers upwards of 10 even when it was not the winning party, whereas the JDS has had the least number, with just 5 of the party’s MLAs being postgraduates across both assemblies. It is observed that the BJP had a twofold increase in the proportion of its postgraduate legislators in 2018 when it won the election, with 12 of its candidates––about 11%––having studied at the Masters level which is a positive development given that they accounted for only 5% in 2013. The BJP, though, has never had a member with a doctorate degree, while both the Congress and the JDS have had one candidate each with a doctorate degree—the Congress being the only party to have an MLA with a Phd in both the elections of the 2010s. Ironically, it is also the Congress party, in absolute terms, with the most number of legislators who did not even complete standard 10 across both assemblies occupying office—with three having studied only till standard 5 and twelve not beyond middle school—even as it has had the most number of graduates cumulatively—a total of 92—with respect to the BJP, which had 66, and the JDS, which had 45 graduate MLAs in the 2010s.
What beyond politics?

Moving on, we must not forget that politicians have other professions apart from, well, being politicians. Karnataka’s data for 2013 reveals that the majority of the state’s legislators were almost equally engaged in business and agriculture with each category accounting for about 30% of the occupation of legislators. Interestingly, 7% of the state’s MLAs declared politics itself as their profession while other occupations account for no more than 10%.
The total wealth of Karnataka’s MLAs in 2013 was about 5000 crore rupees. As per data scraped from the affidavits of candidates made publicly available on the MyNeta portal, in the business category, MLA Priya Krishna from the Congress declared the highest value of assets, pegged at 910 crores, while in the category of agriculture, N. Nagaraju from the Congress declared the highest figure at 470 crores. Interestingly, of the top three candidates with the most wealth, the second and third places were held by MLAs who had not studied beyond class 8, each possessing assets worth 470 crores and 288 crores respectively, and of the top ten MLAs with the most value of assets, 70% were from the Congress.
The rich get richer
Come 2018, and we see the same trend in the incumbent BJP government—agriculture and business remain the predominant occupations of the state’s legislators, with a marginal increase in the number of businesspersons amounting to 33%, while agriculture remained at around 30%. The total wealth of Karnataka’s legislators in 2018 was about 8500 crores or over a billion US dollars.
In 2018, it was N. Nagaraju—who held the second place in the previous assembly in terms of asset value—who emerged as the richest winning candidate—with a declared wealth of 1015 crores, double of what was declared in 2013—followed by DK Shivakumar, listed as an educationist and social worker in his affidavit, whose declared wealth was 840 crores—more than a 300% increase over a span of 5 years. Both candidates belong to the Indian National Congress, with N. Nagaraju, the richest MLA, not having studied beyond class 8.
What the data says
To summarize, one sees that there has been no notable change in the socio-economic backgrounds of Karnataka’s legislators in the governments that were formed in the 2010s. Both governments—steered by the Congress in 2013 and the incumbent BJP in 2018—continue to have graduate MLAs accounting for no more than 58% of the legislature, with the number of MLAs with just school leaving certificates being independently comparable to the number of graduates, graduate professionals, and post-graduates.
Though the opportunity to contest elections regardless of socio-economic backgrounds is a democratic right, evidence from research published by the Indian Statistical Institute suggests that the educational qualification of politicians directly affects public health outcomes, with a significant reduction, for instance, in child mortality observed when an electorate is represented by a graduate politician. Similarly, economist Timothy Besley et al. stipulate in their research that politicians with a higher level of education drive higher economic growth—all of these being aspects that impact and shape the everyday lives of citizens.
It cannot be ignored, however, that several other factors come into play to determine the efficiency of a politician, but even as Karnataka is making leaps and bounds in the realm of innovation, having topped the NITI Ayog’s India Innovation Index consecutively starting from its first edition in 2020, it will suit the state better to have a higher proportion of graduates in its government than it has now. Further, the near absence of women in Karnataka’s government is particularly jarring.
Whether there will be a change in the status-quo in the 2020s—for women’s representation and the stagnant socio-economic backgrounds of the state’s politicians—one has to wait and see, with hope.
References:
- “Why Karnataka Got Record 45% of India’s Total FDI in First Half of This Financial Year.” The Print, n.d. https://theprint.in/economy/why-karnataka-got-record-45-of-indias-total-fdi-in-first-half-of-this-financial-year/811995/.
- “With $10.8 Billion, Bengaluru Top City on Startup Funding in 2022.” Economic Times , n.d. https://economictimes.indiatimes.com/tech/funding/with-10-8-billion-bengaluru-top-city-on-startup-funding-in-2022/articleshow/96859580.cms?from=mdr.
- “Karnataka 2013 – Election Summary ,” n.d. https://myneta.info/karnataka2013/index.php?action=show_winners&sort=asset.
- “Karnataka 2018 – Election Summary ,” n.d. https://myneta.info/karnataka2018/index.php?action=show_winners&sort=asset.
- Anil, Deepthi Sara, Debayan Pakrashi, and Soham Sahoo. “Do Educated Politicians Facilitate Better Public Health? Evidence From India .” Indian Statistical Institute, Delhi , n.d. https://www.isid.ac.in/~epu/acegd2022/papers/Deepthi_Sara_Anil.pdf.
- Besley, Timothy, Jose G. Montalvo, and Marta Reynal‐Querol. “Do Educated Leaders Matter?” The Economic Journal 121, no. 554 (2011). https://doi.org/10.1111/j.1468-0297.2011.02448.x.
- Rep. India Innovation Index . Niti Ayog, n.d. https://www.niti.gov.in/social-sector-indices.
About:
Aishwarya Sunaad is a student at Ashoka University and a research associate at the Trivedi Centre for Political Data
Disclaimer
This article belongs to the author(s) and is independent of the views of the Centre.