

Aishwarya Sunaad
12 April 2021 | 4 min read
The last decade has witnessed an increased focus on conversations around women’s participation in the public sphere supported by calls to strengthen women’s rights. In this context, looking at how women have fared in politics, will help us draw insights into what the role of women will be like in shaping India’s political future. With West Bengal and Assam going to polls in 8 and 3 phases respectively across the months of March and April this year, looking at the number of women who have contested elections in these two states in the past, while also paying attention to their success rates, will throw light on the dynamics of gender in the politics of these states.
Using the Data
To begin with, let’s look at the number of women who contested in West Bengal and Assam in the 2016 assembly elections and their success rates. For this we first look at TCPD’s Incumbency Visualization tool for the profile of the 16th West Bengal Vidhan Sabha.
Figure 1: Women who contested in West Bengal’s 2016 assembly elections as reflected in TCPD’s incumbency visualisation tool
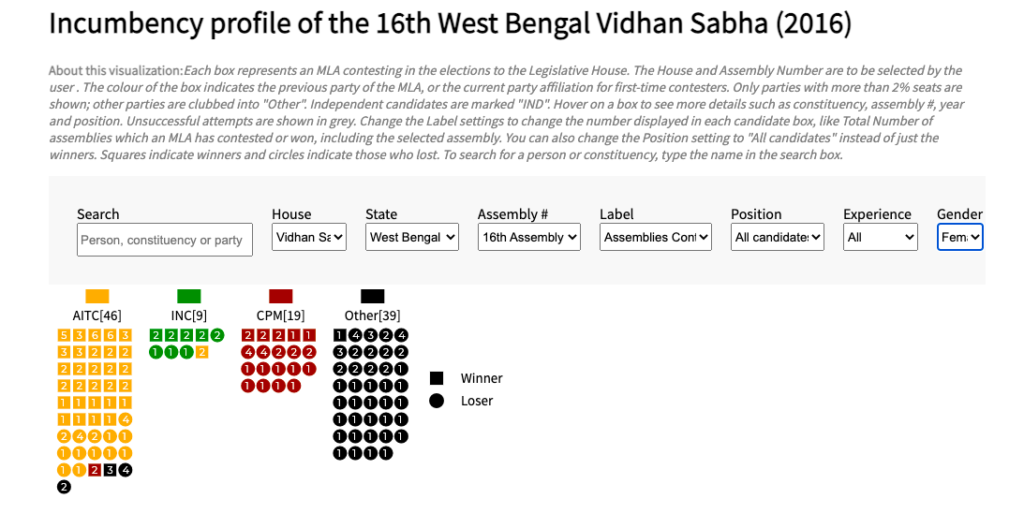
In the figure above, you will see that the following selections have been made in the tool:
- Label: Assemblies Contested
- Position: All Candidates
- Experience: All
- Gender: Female
By adding the numbers appearing in brackets next to each party abbreviation, we get a total of 113 women who contested elections in 2016. However, this does not give us the complete picture: it is important to note that the incumbency visualisation tool, for convenience of viewing, displays data only for:
a) Contestants who came first or second in the election regardless of their party affiliation
b) Contestants who belong to a party that won more than 2% seats of the seats
c) Or both.
This means that there could be contestants who do not meet either of these two conditions. So for detailed results, we look into TCPD’s data collation tool Lok Dhaba by scrolling to the bottom of the incumbency profile page and clicking on Browse/download detailed results.
Lok Dhaba
Lok Dhaba allows us to access several components of electoral data––starting from the number of votes a particular candidate got to details on defections. Hence, downloading data from Lok Dhaba gives us a complete overview. Upon downloading the data, we make the following selections to get the total number of women who contested elections in West Bengal in 2016.
- Year: 2016
- Poll no.: 0 (1 means a bye-poll)
- Party: We deselect NOTA as we are interested in looking only at individuals
- Sex: ‘F’ for Female
Similarly, we follow the same steps to get data for the 2016 Assam Vidhan Sabha elections. The number of women who contested in both states in the 2016 elections is summarised in the table below.
Table 1: Number and percentage of women candidates in the 2016 assembly elections in Assam and West Bengal
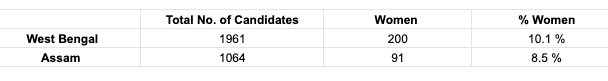
We see that more women contested from West Bengal and consequently held a higher share compared to Assam. But this higher number in comparison to Assam is also because the total number of candidates from Assam, we observe, was lesser than in West Bengal. Importantly, this is because Assam has a lesser number of constituencies––126––in comparison to West Bengal which has 294. Therefore, it becomes imperative to look at data from across multiple elections. Table 2 summarises the number and percentage of candidates who have contested elections in both states across 5 assembly elections. Figure 2 shows the same in the form of a graph.
Table 2: Number and percentage of women candidates in Assam and West Bengal
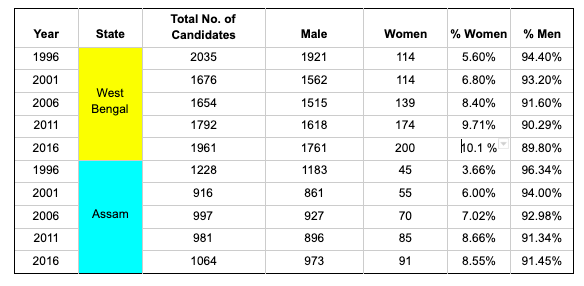
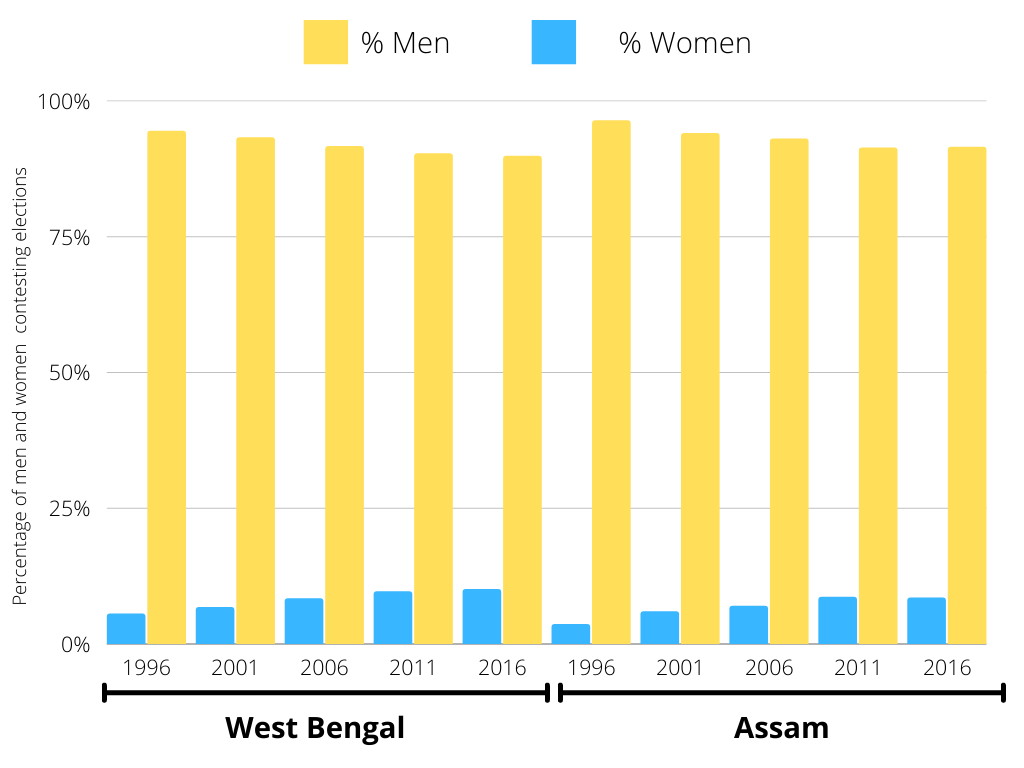
Figure 2: Percentage of women contesting elections in Assam and West Bengal across 5 assembly elections
Women in Politics
We see from Figure 2, that as compared to the share of male contestants, the share of women contestants in assembly elections is very low. While the share of male contestants in both states does not dip beyond the 89% mark, women contesting elections barely crosses 10%, indicating that there is still a long way to go for these two states to achieve gender balance in politics where women occupy a share of at least 50% in terms of contesting elections. However, we see that the percentage of women contesting has marginally increased in every election in both states over the years which is a positive sign.
Against All Odds: How Women Have Performed
We have so far looked at the share of women candidates across the last 5 assembly elections. While we see that the share of women contestants is low relative to male contestants, looking at the performance of women will help us further understand the place occupied by women in the politics of these two states.
For this, we go back to our downloaded data from Lok Dhaba and make the following selections:
Poll no. → 0 (1 means a bye-poll)
Position → 1
Sex → ‘F’ for Female
From an inspection of the assembly constituency maps in Lok Dhaba, we see that the number of constituencies in West Bengal and Assam are 294 and 126 respectively. It is crucial to look into the performance of women to ascertain their representation in the legislative assembly. The following table shows how many seats were won by women and Tables 4.1 and 4.2 indicate their party affiliations.
Table 3: Success rate of women in the last 5 West Bengal and Assam assembly elections
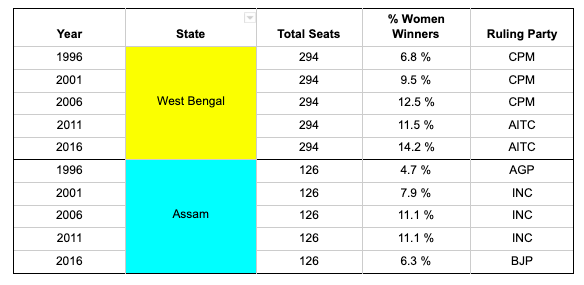
The Spotlight on Assam
We see that the percentage of women who won is in the 6-14% range across both states. While West Bengal has seen a consistent increase in the performance of women across the last five elections, Assam shows a significant decline of 5% in 2016 after a positive upward trend from 1996 onward. The timing of this decline coincides with the Bharatiya Janata Party’s (BJP) coming to power in the state for the first time. We also observe that the success rate of women was highest when the Indian National Congress (INC) was the ruling party.
Now that we have looked at the success rate of women candidates in relation to the ruling party in the states, it will be insightful to go through the number of women who contested and won across various political parties over the last five elections. This will help us understand which parties give women tickets and consequently, how they perform. Table 4.1 and 4.2 give us a party-wise break-up of how many women candidates each party fielded and how many subsequently won. Table 4.1 shows data for West Bengal while Table 4.2 shows data for Assam.
The Chosen Ones
We have considered the two main national parties, Indian National Congress (INC) and Bharatiya Janata Party (BJP) along with 2 state parties for each of the states. The state parties for West Bengal include the All India Trinamool Congress (AITC) which was formed after a break from the INC in 1999, and the state’s oldest party, the Communist Party of India (Marxist) (CPM), which ruled West Bengal for three decades and was the world’s longest serving democratically elected communist government. For Assam, we look at the Asom Gana Parishad (AGP) and the All Indian United Democratic Front (AIUDF).
Table 4.1: Number and performance of women candidates in West Bengal across political parties
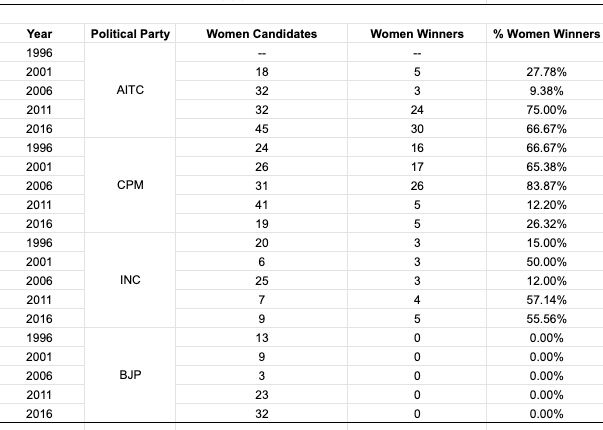
We see that while the CPM, until 2006, had the highest number of women candidates who won, the number reduced drastically in 2011 by nearly 80%. This decline corresponds to the AITC coming to power in 2011 and its women candidates winning 25 seats as opposed to CPM’s 5 seats. The AITC, led by Mamata Banerjee has since seen the most number of successful women candidates in the assembly elections––31––and has also fielded the most number of candidates in comparison to other parties..
Since 1996, the Congress party has shown very marginal increases in the number of women candidates who won but also fluctuations in the number of candidates it fielded in the first place. Between the elections in 1996 and 2001, there was a drastic fall in the number of women who contested on an INC ticket and a similar increase in the number who contested in 2006. Though the percentages of women who won may look inflated because of the fluctuations in the total number of candidates, we see that the number of women who won has increased by only 1 candidate in every election with the maximum number of women that won on an INC ticket from 1996 to 2016 being only 5. This is opposed to the performance of women on an AITC ticket with as many as 30 candidates winning in 2016 while only 5 from the Congress won: this comparison between the AITC and the INC is crucial since the AITC was formed after breaking from the Congress party in 1999 due to internal disagreements.
Interestingly, we observe that the BJP has been unsuccessful in sending any woman candidate to the West Bengal legislative assembly despite showing an increase in the number of women it fielded and in spite of being the ruling party at the Centre.
Table 4.2: Number and performance of women candidates in Assam across political parties
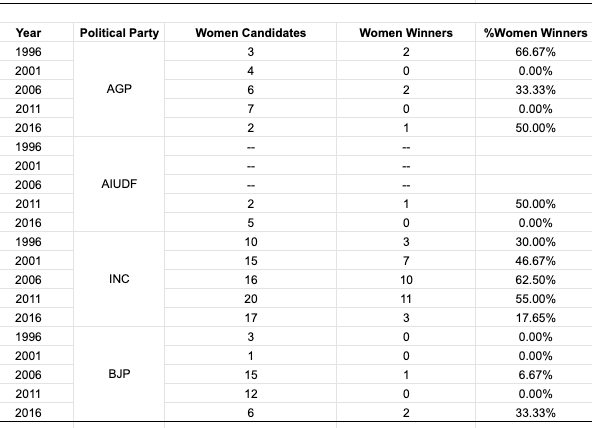
We observe from the table, in contrast with its performance in West Bengal, that the Congress party in Assam has fielded the most number of women candidates since 1996 compared to the other parties and has also had the highest number of successful candidates. Despite the BJP winning the most number of seats in Assam’s 2016 assembly elections, the data tells us that it fielded only 6 women candidates out of which only 2 won. This is a very low number for a party that won, along with its coalition allies, 86 of the 126 seats in Assam in 2016.
Coming to the state parties, both the AGP and AIUDF consistently show very low figures for women candidates and also poor performance numbers with a maximum of 2 women being sent to the legislative assembly across both parties. It is important to note that the AGP was an ally of the BJP in the 2016 elections: therefore, decisions on which candidates to field may have been decided across the coalition parties resulting in a strategically smaller number of women candidates from the AGP––the lowest figure of only 2 candidates–– than in the previous years.
Importantly, we see that national parties have fielded more women candidates than the state parties in Assam. One of the reasons for this may be the appeal for contesting from national parties which, by virtue of their size and resources, are perceived to enable stronger chances of winning as opposed to state parties. While this data allows us to speculate causes and reasons, in-depth fieldwork and research is the way to understand the story behind the numbers. One can say, then, that an important function of this data is that it opens avenues for further research in topic areas than just reflect trends.
Woman Power
From the above data, we conclude that the share of women contesting and winning in assembly elections in West Bengal and Assam is poor in relation to the number of male candidates. This points to a gender imbalance in the politics of the two states even though we have seen the overall number of women candidates marginally increasing across the last 5 elections in both states. In West Bengal, while state parties like the CPM and AITC fielded the most number of women candidates in comparison to the national parties, in Assam it has been the opposite: INC and BJP, both national parties, have supported more women candidates than the state-level parties. In Assam, after years of consistent improvement, we see a significant decline in the share of women winning in the 2016 elections in comparison to the previous years: a reduction of nearly 5% as visible in Table 3. This coincides with the BJP coming to power in Assam in the same year. The BJP’s success in Assam marks a change in the state’s political trajectory which was dominated by the Congress party from the beginning of the 21st century. Similarly, the AITC brought the Communist Party’s long domination to an end in 2011 but this disruption in 2016 resulted in the highest figure in the performance of women candidates since 1996. We surmise from the data that in terms of national parties, the INC has backed more women candidates and in terms of state parties, it has been the AITC. Furthermore, the BJP which holds power at the Centre and has been successful across several states in the country, still needs to improve in West Bengal and Assam with respect to the number of women it sends to the legislative assembly.
Even though there appears to be a long way to go for both Assam and West Bengal to have a favourable share of women in the Vidhan Sabha, the consistent––albeit marginal––increase in the number of women contesting and winning in these two states from 1996 onwards indeed offers a ray of hope.
Acknowledgements: Ananay Agarwal for verifying data and Priyamvada Trivedi for editing
We encourage you to explore the data and use the incumbency tool. It is the product of a lot of time, hard work and love put in by TCPD staff members and our fabulous interns. If you spot errors and/or have any feedback, please get in touch with us at tcpd-contact@ashoka.edu.in
References
“TCPD Individual Incumbency Dataset, 1962-current”. Trivedi Centre for Political Data, Ashoka University.
Ananay Agarwal, Prashasti Agarwal, Payoja Ahluwalia, Saloni Bhogale, Jenish Raj Bajracharya, Sudheendra Hangal, Samridhi Hooda, Mohit Kumar, Visvesha Murthi, Basim U Nissa, Vaibhav Parik, Ayaan Sagar, Niharika Tiwari and Gilles Verniers. 2021. “TCPD Individual Incumbency Dataset, 1962-current Codebook 1.0″, Trivedi Centre for Political Data, Ashoka University.