

Aishwarya Sunaad, Basim-U-Nissa and Priyamvada Trivedi
23 April 2021 | 4 min read
In this piece we take a closer look at the experience of winners to the Kerala Vidhan Sabha across the last 5 elections. Specifically, we focus on the following types of winners:
- Newcomers: candidates who have won for the first time
- Turncoats: candidates who contested from a different party in the previous election
- Stable political class: candidates who have served more than 2 terms
Please note that these definitions can be found in our detailed documentation.
To help us engage better with the data, we have utilised screenshots of your data and its corresponding visualisations, both of which can be found on our website. We would suggest that you have a look at our visualisations and use this as a guide.
Figure 1 shows all the winners across parties that won more than 2% of the seats in the last election, which was held in 2016 to the Kerala Vidhan Sabha. Note that the “Experience” drop-down is selected to include “All”. The party abbreviation is followed by the total number of winners for each party. For example, Communist Party of India (Marxist) (CPM) won 58 seats, the Indian National Congress (INC) won 22 seats and so on. Adding up seats for all the parties gives us 140 seats that the Kerala legislative assembly is composed of.
Figure 1: Winners in the 15th Kerala Vidhan Sabha

Moving on to the different types of ‘experience’ of the winners, Figures 2, 3 and 4 show newcomers, turncoats and the stable political class respectively for the 15th Kerala Vidhan Sabha. These figures are generated by selecting the different options listed under the “Experience” dropdown menu. The definitions for the above 3 have been mentioned in the start of this column.
Figure 2 shows that the 15th Kerala Vidhan Sabha had 48 newcomers i.e., those who won a seat for the first time. Half of these (24 out of 48) newcomers won their seat on a CPM ticket. In relation to Figure 1, we can also say that 24 out of the 58 CPM winners are newcomers or about 41% of CPM winners are newcomers. Similarly, 6 out of the 48 newcomers won on an INC ticket, 7 on an CPI ticket, 8 on an IUML ticket, 1 on an Independent ticket and 2 on Other party tickets.
Figure 2: Newcomers in the 15th Kerala Vidhan Sabha

Figure 3a shows the distribution of the number of turncoats i.e., those who contested on a different party ticket in the previous election. We observe a total of 11 turncoats out of which 10 are with the IUML. If we look more closely at these 10 individuals, we find that their previous party was the Muslim League (MUL). For instance, hovering over the first square block (Figure 3b) in the first row under IUML, we see that the winner is P. K. KUNHALIKKUTTY who won from VENGARA. We can also see that P. K. KUNHALIKKUTTY won in the last election of 2011 from the same constituency. Given this, we look deeper and find that MUL and IUML are the same i.e., MUL changed names to IUML. So why 2 different abbreviations for the same party? TCPD uses party abbreviations that are provided in the statistical reports released by the Election Commission of India (ECI). For the years of 1996, 2001, 2006 and 2011, ECI lists MUL and in 2016, the party is listed as IUML. We have a working paper in progress that will delve into the details of factions and merges for Indian political parties across time (Nissa et. al).
Figure 3a: Turncoats in the 15th Kerala Vidhan Sabha

Figure 3b: Inspecting turncoats

Lastly, we look closely at the stable political class i.e., those who have served more than 2 terms. Each of the squares in Figure 4 represents the number of terms served for every party that won greater than 2% of the seats. Out of the 58 seats won by CPM, 18 were won by those who had previously won at least 2 terms i.e., about 31% of the CPM MLAs form a stable political class according to our definition.
Figure 4: Stable political class in the 15th Kerala Vidhan Sabha

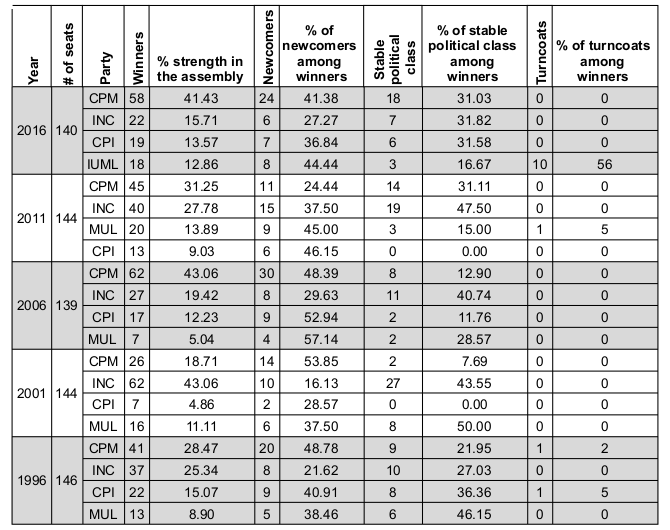
We repeat the above process for the previous four assembly elections held in 2011, 2006, 2001 and 1996 respectively and focus on CPM, INC, CPI and IUML/MUL and present statistics showing the number and percentage of winners, newcomers and turncoats in Table 1. The subsequent sections are an analysis of the statistics presented in Table 1. You can get the raw data by downloading it from here.
Table 1: Statistics showing newcomers, turncoats and the stable political across the last 5 elections for 4 political parties
We understand newcomers as those members of the assembly who were elected for the first time, irrespective of the number of their previous contests. For instance, a newcomer could have contested in 2001, 2006, 2011 and 2016 but won for the first time in 2016. In such a case, the candidate has been classified as a newcomer.
For Kerala, since 1996 (Figure 5), a significant percentage of winners from the four major parties – CPI, INC, CPM, MUL – were elected for the first time. This percentage is the lowest for INC in 2001 when only 16.13% of its winners were elected for the first time. By contrast, this percentage is the highest for MUL in 2006, when 57.14% of its winners were elected for the first time.
For CPM, its highest percentage of newcomers among winners was in 2001 with 53.85%. The percentage decreased over the next two elections to 24.44%. On the other hand, 52.94% of winners from CPI were newcomers in 2006. The lowest number of newcomers among winners for CPI was in 2001, with 28.57%.
Figure 5: Party-wise percentage of newcomers

Turncoats across parties
We understand turncoats as those candidates who switch parties between elections. In Figure 6, we see that 56% of MUL winners in 1996 were turncoats. 5% of CPI and MUL winners were turncoats in 2001 elections. 2% and 5% of CPM and CPI respectively were turncoats.
Figure 6: Party-wise percentage of turncoats

Stable political class across parties
We understand a stable political class as composed of those politicians who have 3 or more mandates i.e, politicians who have won 3 elections irrespective of the number of times they have contested. We look at these numbers to assess the party’s tendency to field politicians with election/legislative experience.
From Figure 7, the size of the stable political class as a percentage of winners in the assembly has been the largest for INC as compared to other major parties like CPM, CPI and MUL. Even though 46.15% and 50% of winners from MUL belonged to the stable political class in the 1996 and 2001 elections respectively, the share of stable political class among MUL winners was almost halved in the following assembly elections in 2006 and further decreased to 15% in 2011 elections. On the other hand, from 1996 elections until 2011, consistently more than 40% of winners from congress belonged to the stable political class.
Among the Left parties, CPM has sent a more stable political class to the Kerala assembly. In the 1996 elections, 21.95% of CPM’s winners had won at least their third mandate. Over the next two elections, this percentage decreased to 7.69% in 2001 and 12.9% in 2006. However, in the last two elections, about 31% of winners from CPM belonged to the stable political class.
On the other hand, CPI has contributed the least number of members to the stable political class in the Kerala assembly. Both in the 2001 and 2011 elections, none of the members of the assembly from CPI belonged to the said class.
Figure 7: Party-wise percentage of stable political class

Conclusions
In this piece, using the case of Kerala, we demonstrated how the TCPD Individual Incumbency Dataset can be used to analyse party-wise newcomers, turncoats and the stable political class over time. Similar analyses should be done for other states and comparisons made to answer deeper questions about possible determinants of observed patterns.
Acknowledgements: Ananay Agarwal for for proof-reading the piece.
We encourage you to explore the data and use the incumbency tool. It is the product of a lot of time, hard work and love put in by TCPD staff members and our fabulous interns. If you spot errors and/or have any feedback, please get in touch with us at tcpd-contact@ashoka.edu.in
References
“TCPD Individual Incumbency Dataset, 1962-current”. Trivedi Centre for Political Data, Ashoka University.
Ananay Agarwal, Prashasti Agarwal, Payoja Ahluwalia, Saloni Bhogale, Jenish Raj Bajracharya, Sudheendra Hangal, Samridhi Hooda, Mohit Kumar, Visvesha Murthi, Basim U Nissa, Vaibhav Parik, Ayaan Sagar, Niharika Tiwari and Gilles Verniers. 2021. “TCPD Individual Incumbency Dataset, 1962-current Codebook 1.0″, Trivedi Centre for Political Data, Ashoka University.
ECI. “Kerala 1996.” Election Commission of India, 20 Aug. 2018, https://eci.gov.in/files/file/3759-kerala-1996/ .
ECI. “Kerala 2001.” Election Commission of India, 20 Aug. 2018, https://eci.gov.in/files/file/3760-kerala-2001/ .
ECI. “Kerala 2006.” Election Commission of India, 20 Aug. 2018, https://eci.gov.in/files/file/3762-kerala-2006/ .
ECI. “Kerala 2011.” Election Commission of India, 20 Aug. 2018, https://eci.gov.in/files/file/3763-kerala-2011/ .
ECI. “Kerala 2016.” Election Commission of India, 20 Aug. 2018, https://eci.gov.in/files/file/3767-kerala-general-legislative-election-2016/ .
Explained Desk. “Explained: History of Muslim League in Kerala and India.” Indian Express, 6 Apr. 2019, https://indianexpress.com/article/explained/explained-the-history-of-muslim-league-in-kerala-and-india-5660839/
Nissa, Basim, Mohit Kumar and Samuel Housekeeper. “Factions and mergers in the Indian party system: Evidence from Individual Incumbency Data,” Working paper.