

Introduction
Growing political contestation in the state of Punjab in the past few years has led to an increasing perception that the state’s politics has been competitive. This was furthered by the claims of a multi-polar contest in the recent elections.1 Certain developments explain this increasing perception. Former two-time Chief Minister Captain Amarinder Singh left the Indian National Congress and his post to form his own party less than nine months ago — opening up the space for new competition. The party subsequently appointed Charanjit Singh Channi – a Dalit Sikh – as its chief ministerial candidate for contesting the elections. The Congress, however, was not the only party engaging in caste politics. Its political rivals, including the Aam Aadmi Party (AAP) and the Shiromani Akali Dal (SAD) actively courted Dalit castes such as Sikhs from the Balmiki/ Majhabhi lineage – which make up about 31% of the SC population.2 Yet, does the data support this? In this article, we explore this question using Effective Number of Parties (ENOP), a metric used to measure party system fragmentation in a given state/constituency. This metric is helpful in explaining voter behaviour vis-a-vis the presence of alternatives. More importantly, at a more fundamental level, it also tells us about electoral competition in a particular state/constituency or region.3
A Glimpse of ENOP in Punjab Over the Years
Figure 1: ENOP Over the Years in Punjab (1967 – 2022)
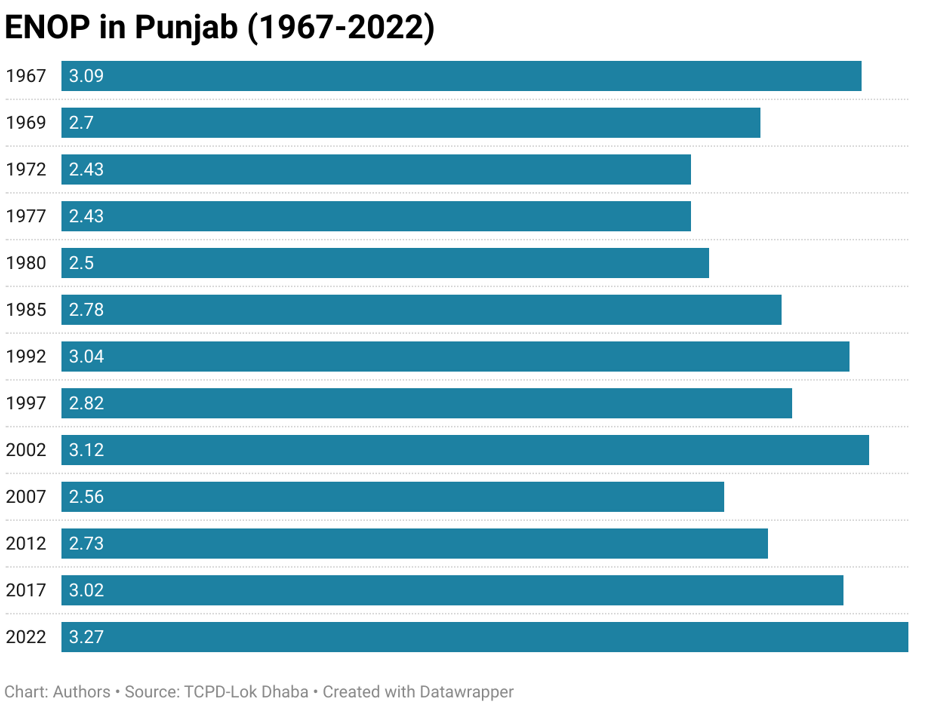
We observe that the value of ENOP has never been perfectly 2 in elections in the state of Punjab (Fig. 1), indicating that the state has never faced an absolute two-party competition in its electoral history. In fact, the value of ENOP has never fallen below 2.43 (Fig. 1). More specifically, there is an increasing trend in the ENOP values after 2007, which forms the main focus of this piece.
Sub-Regional Analysis of ENOP in the Past Three Elections
Let us look at the data from the past two assembly elections of 2012 and 2017 in Punjab. As Figure 1 shows, the assembly elections of 2012 and 2017 formed a part of a larger trend of increasing ENOP since 2007. In 2012, the state ENOP value was 2.73, increasing from 2.56 in the preceding 2007 elections (Fig. 1). Similarly, in 2017, there was a further increase in state ENOP value to 3.02, indicating that electoral competition in the state evolved into a three-way contest. This can be attributed to the Aam Aadmi Party’s successful entry into the Punjab politics in 2017.5
In particular, we focus on the trends in ENOP in the three main sub-regions of Punjab, namely Malwa, Majha, and Doaba. The striking thing to note is that ENOP increased in all three sub-regions over the past two elections—just like the overall state ENOP increment. Data indicates that the ENOP value increased by 0.3 units in each sub-region. It increased from 2.8 to 3.1 in Malwa, 2.4 to 2.7 in Majha, and 2.9 to 3.2 in Doaba (Fig. 2). This is an indicator of an overall trend of increasing electoral competition in the state. One implication of this rise in ENOP across sub-regions is the rise in voter engagement. This rise in voter engagement here does not necessarily mean that the turnout percentage has increased. In fact, this rise in voter engagement is truly inferred from the ENOP value which has increased despite the fact that the actual vote share percentage has decreased over the past three election cycles. In other words, high ENOP is indicative of greater electoral competition in terms of how the votes are distributed among the parties and not the amount of votes polled.
Figure 2: Sub-Region-wise ENOP trends in Punjab for AE 2012, 2017, and 2022
(Round-off values)
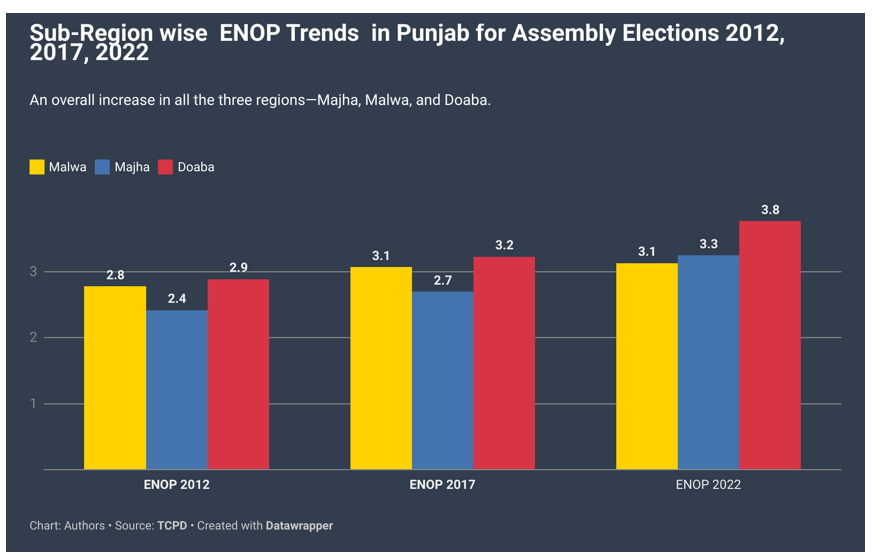
Consistent with the past trends, the state-wide ENOP rose yet again from 3.02 in 2017 to 3.27 in 2022, after the AAP’s historic first win in the state. There was a particularly sharp rise in ENOP values in the sub-regions of Majha and Doaba, where ENOP rose to 3.25 and 3.77 respectively.
Conclusion
The measure of ENOP, therefore, helps in making two clear observations regarding the party competition in the state of Punjab. First, that the state of Punjab has never witnessed perfect competition during elections (i.e. effectively a two-party contest). Second, the continuous rise in the state and sub-region-wise ENOP value suggests greater political competition due to the influx of new political actors in the state. With the AAP’s victory in the recent assembly elections, it remains to be seen whether new political actors will continue to grace Punjab in subsequent elections and result in increasing electoral competition.
About the authors
Nachiket Midha is currently a sophomore at Ashoka University studying Political Science and minoring in International Relations.
Kartikeya Reddy is currently a second-year undergraduate student at Ashoka University. He is majoring in Political Science and minoring in Computer Science and International Relations.
Acknowledgements We would like to express our gratitude to Professor Rahul Verma (CPR) and Vaibhav Parik (CPR) for their assistance in guiding us. We would also like to thank the entire TCPD team for their continued efforts in compiling a comprehensive dataset on candidates contesting in Indian Elections and for their valuable feedback and suggestions throughout the process
References
1. Sharma, Nidhi. “Punjab Polls: Witnessing a Multi-polar Contest.” The Economic Times, 19 Feb. 2022, economictimes.indiatimes.com/news/elections/assembly-elections/punjab/punjab-polls-witnessing-a-multi-polar-contest/articleshow/89672632.cms.
2. “Whether Dalit Polarisation Will Reap Benefits in Punjab Has to Be Seen.” The Economic Times, 14 Feb. 2022, economictimes.indiatimes.com/news/elections/assembly-elections/punjab/whether-dalit-polarisation-will-reap-benefits-in-punjab-has-to-be-seen/articleshow/89575839.cms?from=mdr.
3. Kishore, Roshan. “3 crucial takeaways from Bengal results.” Hindustan Times, 4 May. 2021, https://www.hindustantimes.com/elections/west-bengal-assembly-election/3-crucial-takeaways-from-bengal-results-101620086556255.html.
4. “TCPD Political Parties of India Dataset (TCPD-PPI), 1962-current Codebook 1.0”, Trivedi Centre for Political Data, Ashoka University.
5. PTI. “Punjab Assembly Elections: Fielding New Entrants by Major Parties Spices Up Contest in Mansa.” News18, 27 Jan. 2022, www.news18.com/news/politics/punjab-assembly-elections-fielding-new-entrants-by-major-parties-spices-up-contest-in-mansa-4704260.html.
6. “TCPD Political Parties of India Dataset (TCPD-PPI), 1962-current Codebook 1.0”, Trivedi Centre for Political Data, Ashoka University.
Disclaimer
This article belongs to the author and is independent of the views of the Centre.