

The entry of Aam Aadmi Party (AAP) in Punjab’s electoral space in 2017 and its subsequent disruption of the political status quo has led to two distinct phenomena–the arrival of a new political class of first-timers who are candidates with no prior experience in contesting elections and an increase in candidates who switched parties following the previous election who are formally classified as ‘turncoats’. The Trivedi Centre for Political Data’s Political Career Tracker tool can be used to analyze Punjab’s assembly elections data from 2007-2022 to understand how parties fielded both these categories. I have chosen to analyze the two categories––first-timers and turncoats––together because both kinds of candidates are ‘new’––the former in an absolute sense and the latter in a relative sense for the party. Through this article, I hope to shed some light on intra-party decisions to field candidates and the inter-party movement of candidates.
Novice vs. Veterans– How experienced are contesting candidates?

Graph 1
Graph 1 demonstrates how experienced a party’s candidates have been over the last four assembly elections in Punjab. The contesting average for each election is calculated by adding up the number of assembly elections contested by all the candidates in a party and dividing it by the total number of candidates in that party. It is important to note that ‘experience’ here is defined by how many assembly elections a candidate has contested in the past, including the election they are contesting at the time.
In 2022, the average number of elections contested by Indian National Congress (INC) candidates was 2.44, almost the same as 2007. As the graph shows, INC’s average has more or less been stable for the last four elections. Shiromani Akali Dal (SAD), on the other hand, has seen an upwards trend in the average contesting experience of candidates– in 2007, it was 2.59 compared to 2.92 in 2022. It must be highlighted that SAD candidates have had more contesting experience than any other party in the last two elections.
On the other hand, we observe that the Bharatiya Janata Party’s (BJP) average has dropped considerably since 2007– from 2.96 then to 1.62 in 2022. A possible reason for this is that after BJP’s falling out with its former ally SAD over the farmers’ protest, it became the senior partner in a new alliance with smaller regional parties. This meant that it had to field more candidates than it ever had in the state. In 2017, when BJP was allied with SAD, it fielded only 23 candidates whereas in 2022 it fielded 73 candidates. Thus, BJP’s drop in its candidates’ contesting average suggests that the party does not have experienced political leaders in the state, a situation that can only change with time. This is not to imply, however, that the higher the contesting average, the more likely it is for a party to win. This is illustrated by AAP which had the lowest contesting average in 2022––at just 1.41––but still managed to win the election with a sizeable victory.

Graph 2
Graph 2 shows the average of assembly elections contested by winners. A noteworthy difference can be seen in the contesting mean of SAD’s candidates and its winners in the 2022 elections– those elected had a contesting average of 2, which is .92 less than the average of all candidates. In other words, voters chose SAD leaders with lesser electoral experience, a hypothesis that can be confirmed by the defeat of its entire top brass, including the Badal family which has dominated the party president post since 1995. In contrast, voters chose INC candidates with more experience both compared to the candidates’ average in 2022 (a difference of .34) and the winners’ average in 2017 (a difference of .29). In the latter case, the difference is small yet significant given that the party went from 81 winners in 2017 to 18 winners in 2022.

Graph 3
Graph 3 shows the number of first-time candidates fielded by parties in the last four assembly elections. There is a spike in the number of first-time candidates fielded by BJP in 2022, for reasons discussed in a previous paragraph. Unsurprisingly, the numbers for AAP are high in both the elections it has contested thus far, suggesting that the party still has an overall inexperienced cadre, or a large number of new faces. A slight dip can be noticed in INC’s and SAD’s numbers since the 2017 election, however it is not apparent what implications this holds.
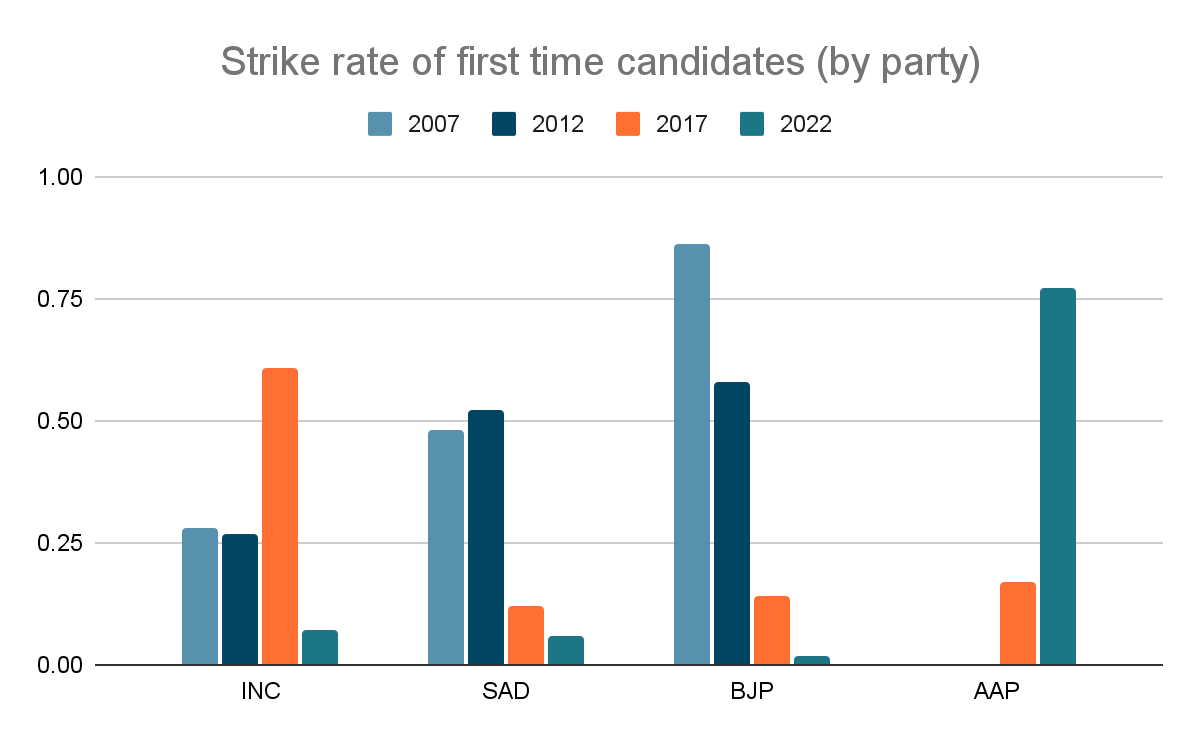
Graph 4
Graph 4 shows the strike rate of first-time candidates. Strike rate is calculated by dividing the number of first-time candidates who won by the total number of first-time candidates contesting. Interestingly, the strike rate for each party is highest in the years it won the election. For SAD-BJP it is 2007 and 2012, for INC it is 2017, and for AAP it is 2022. Thus, we can surmise that election victories not only allow parties to control the government but also groom a generation of novice political leaders.
The World of Turncoats
Moving on, let’s examine inter-party movement by looking at the ‘turncoat’ variable in TCPD’s dataset which indicates if a candidate has switched their party from the immediately preceding election or not. Table 1 shows how many turncoats entered and left each party since the preceding election. It also includes turncoats that contested bye-elections for the said assembly session.
Movement of turncoats:
| INC | Entered (in current election) | Left (from previous election) |
| 2007 | 4 | 1 |
| 2012 | 1 | 1 |
| 2017 | 7 | 7 |
| 2022 | 2 | 10 |
| SAD | Entered | Left |
| 2007 | 8 | 2 |
| 2012 | 3 | 6 |
| 2017 | 5 | 5 |
| 2022 | 5 | 7 |
| BJP | Entered | Left |
| 2007 | 1 | 0 |
| 2012 | 0 | 0 |
| 2017 | 0 | 0 |
| 2022 | 6 | 1 |
| AAP | Entered | Left |
| 2007 | NA | NA |
| 2012 | NA | NA |
| 2017 | 7 | 0 |
| 2022 | 4 | 3 |
Table 1
To make sense of Table 1, I propose the “Turncoat Volatility Index” that measures the movement of turncoats to and from each party. The index value is unique to each party and to each election year– it only calculates turncoats consequential to a party for the said election (including subsequent bye-elections). Here is the formula to calculate the index–
[(Turncoats left from previous election/total party candidates in previous election) + (turncoats joined in current election/total party candidates in current election)]/2
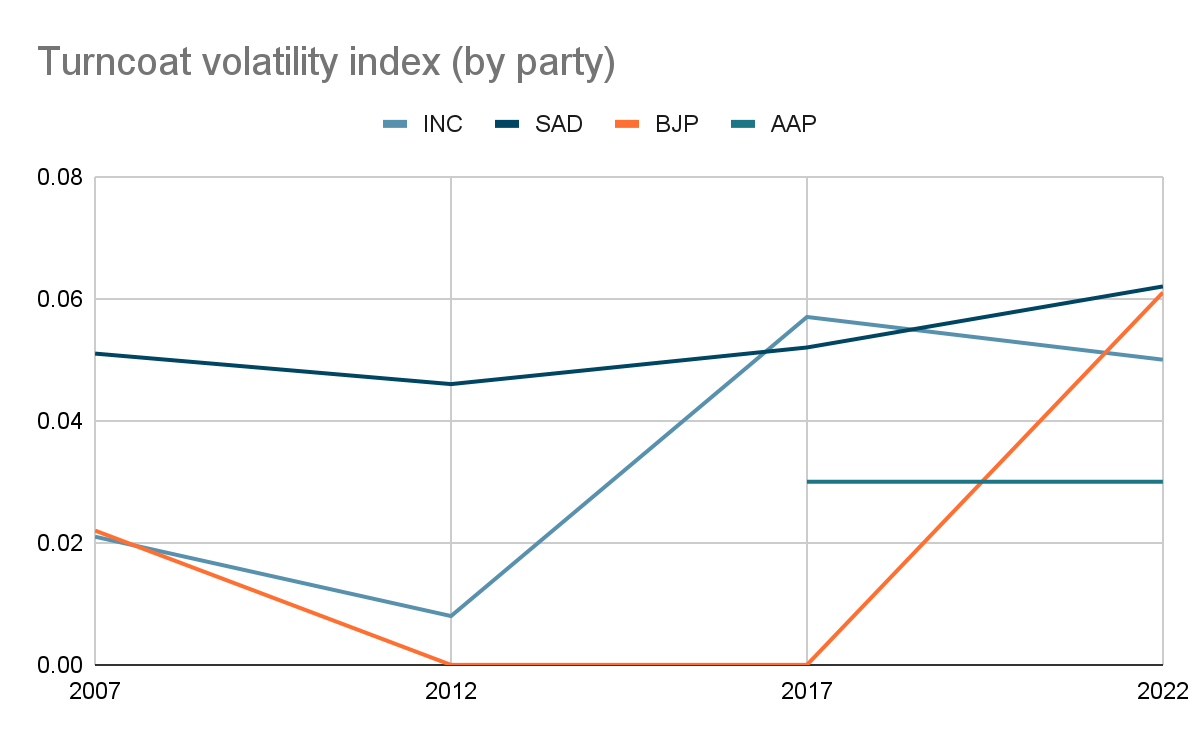
Graph 5
Graph 5 shows the turncoat volatility index value for each party for each of the last four elections. Except for AAP, all parties have become more volatile in the past few years when it comes to the movement of members to/from other parties. SAD is the most volatile party in 2022, closely followed by BJP, then INC and finally AAP with a much lower score. The graph suggests that Punjab politics has become more unstable with regards to intra-party movement in recent years, a trend that will be closely watched in future elections.
While SAD has been more volatile than other traditional parties like INC and BJP, it is unclear what has caused a spike in the index values for the latter two parties in recent elections. Perhaps the BJP’s breakup with SAD made it more welcoming of turncoats as it received six turncoats in 2022 against losing one. It is not improbable that the party wanted experienced candidates from other parties to compensate for the overall inexperience of its candidates. Furthermore, of the 16 candidates that left INC for other parties in 2017 and 2022, 5 each joined AAP and SAD, and 2 joined BJP. Thus, it can be argued that AAP’s entry into Punjab politics, SAD’s historical volatility, and BJP’s evolution from a junior partner in its alliance with SAD to a senior partner in its alliance with Punjab Lok Congress and Shiromani Akali Dal (S) have made the INC more volatile.
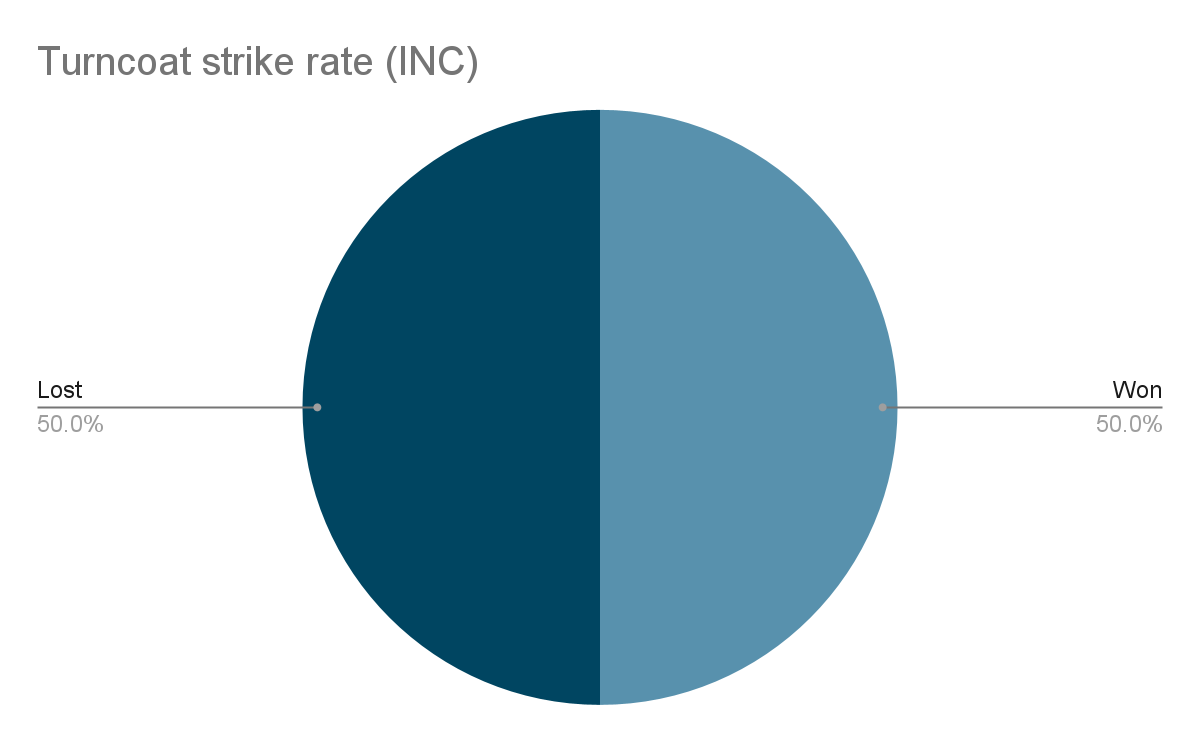
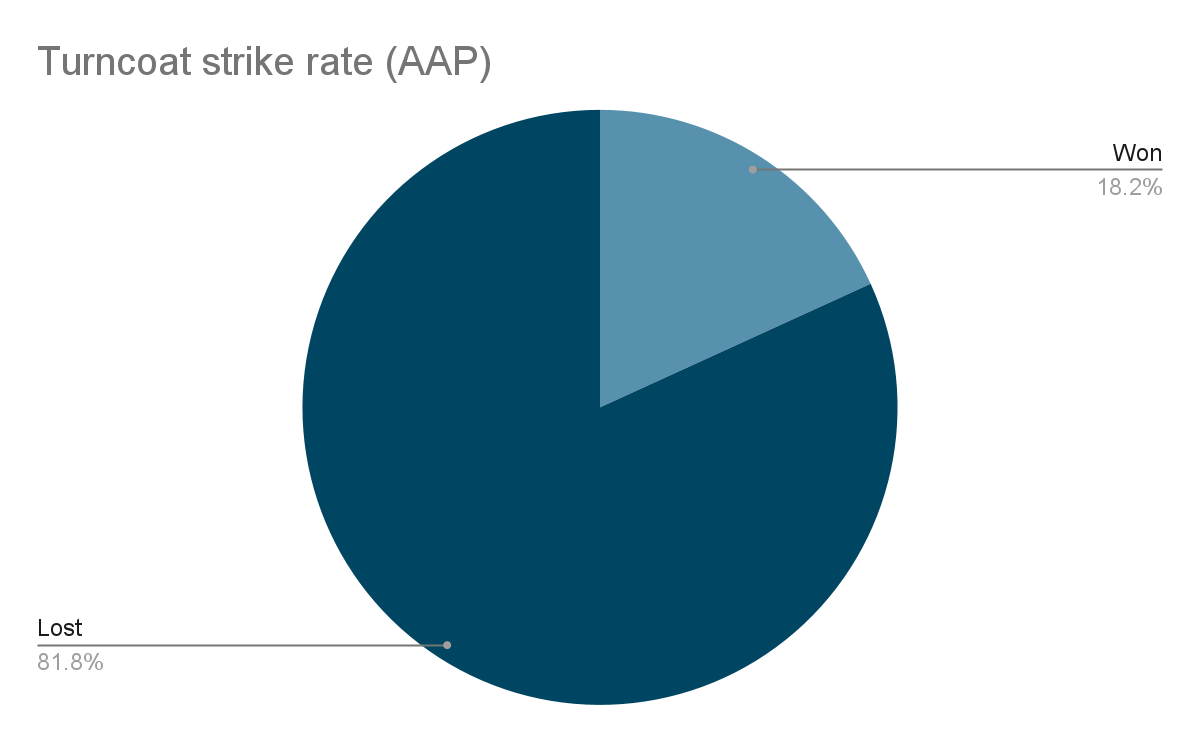
Pie charts 1-4 show the strike rate of turncoats contesting from each of the parties over the last four elections. Turncoats in INC have won 50% of the time, followed by 45.5% of the time in SAD. Performance of turncoats in BJP and AAP has been relatively worse.
Pie chart 1
Pie chart 2
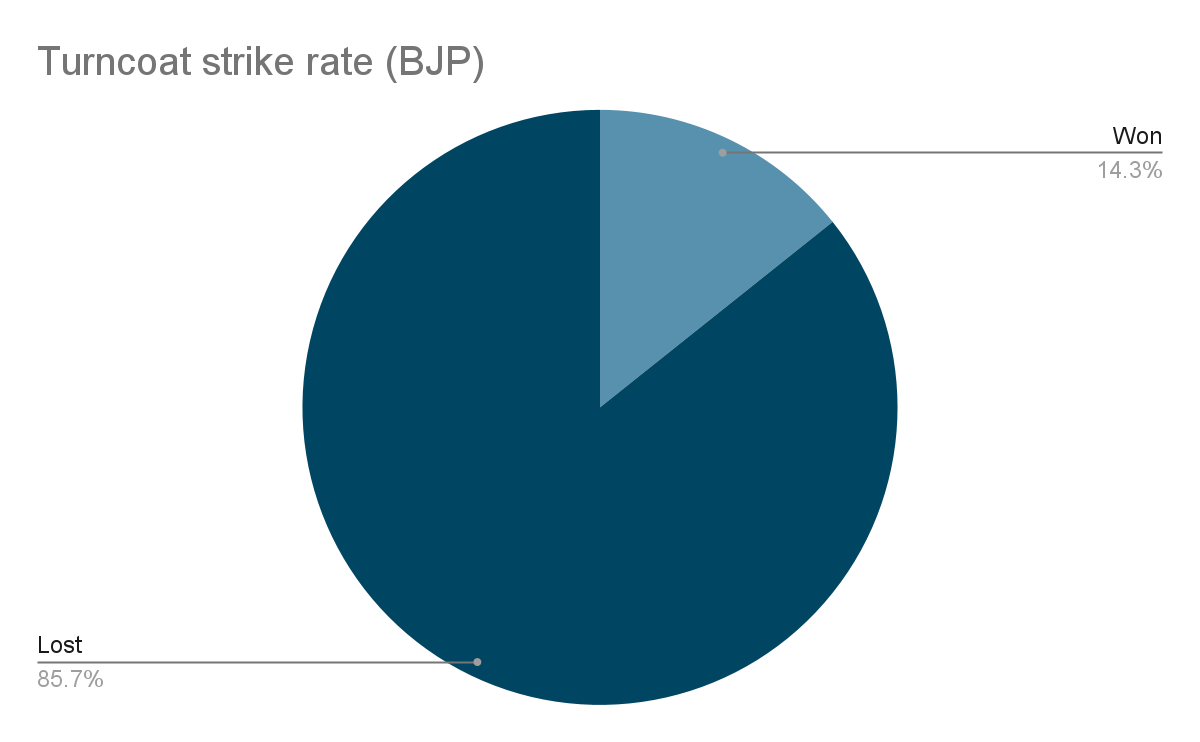
Pie chart 3
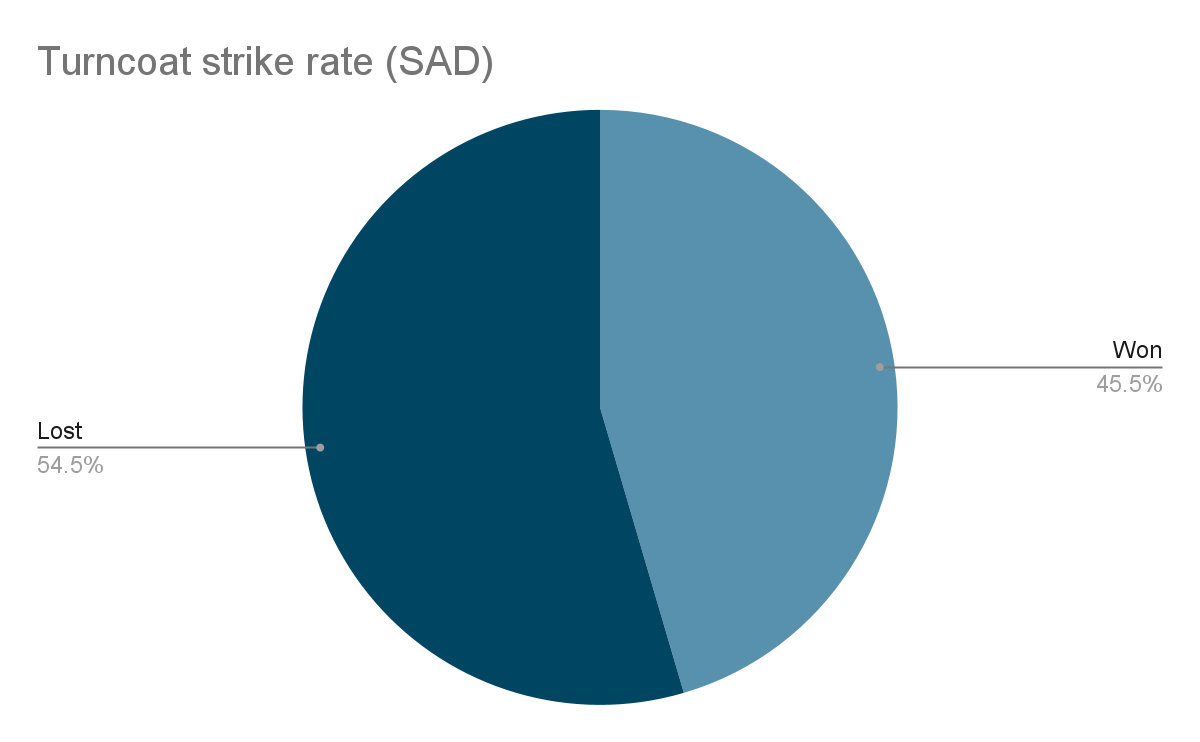
Pie chart 4
Pie charts 5-6 show the strike rate of turncoats depending upon whether or not they re-contested from the same constituency as in the preceding election. Counterintuitively, candidates who have not re-contested from the same constituency have won 41.7% of the time compared to when they have re-contested, for which the strike rate is 33.3%. Still, of the 54 turncoats in question, 78% of them have re-contested from the same constituency as in the preceding election (see Table 2).

Pie chart 5
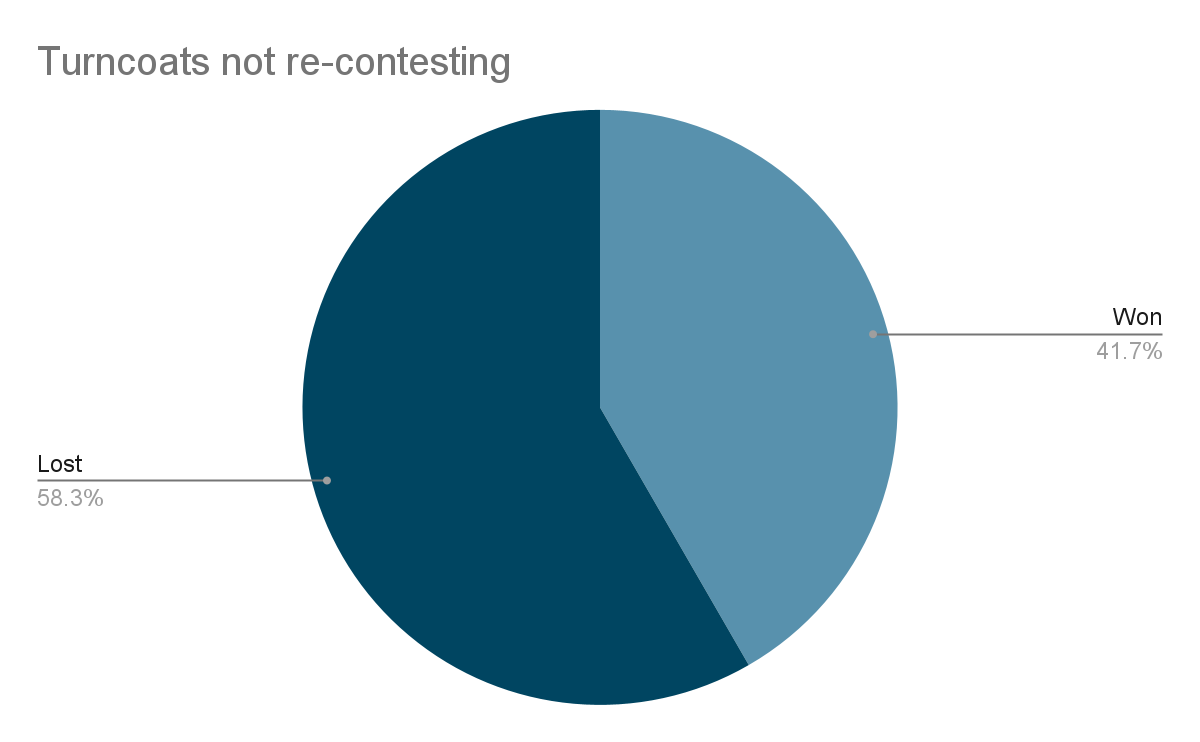
Pie chart 6
| Re-contested | Not re-contested | |
| Turncoats | 42 | 12 |
Table 2
Conclusion
To conclude, I will summarize three key takeaways from the above analysis. Firstly, the rejection of SAD’s top leadership and its historically high turncoat volatility means that the party is experiencing an existential crisis. Even though its candidates were the most experienced in the 2022 assembly elections, only three of them won. Secondly, the contesting average of INC’s winners in the most recent assembly elections is lesser than the contesting average of all its candidates. This could mean that the party leadership has lost its electoral appeal. Take for instance its CM candidate Charanjit Singh Channi who lost in both the seats he contested or the then state party president Navjot Singh Sidhu who also lost. In terms of turncoat movement too, INC has become increasingly volatile over the past two decades, losing more turncoats than gaining. Finally, since BJP became the senior leader in an alliance for the first time in Punjab, it fielded an exceptionally high number of newcomers. While it may not have worked in its favour this time around, it will only help strengthen its cadre for future elections.
About the Author
Aggam Walia worked as an intern at TCPD from December 2021 to August 2022. As an ASP student at Ashoka University, he is writing a thesis on the 2020-21 farmers’ movement under the Political Science department.
Acknowledgements
I would like to express my gratitude towards Aishwarya Sunaad for their feedback and suggestions.
References
- Kumar, Ashutosh. “Election results: 5 reasons why SAD was crushed in Punjab elections” Hindustan Times, March 12, 2017. https://www.hindustantimes.com/assembly-elections/5-reasons-why-sad-was-crushed-in-punjab-elections/story-e11JwWMbftVZGgNmTIcnLO.html
- Kumar, Ashutosh. “The long, steep road ahead for the Akali Dal” The Hindu, July 14, 2022. https://www.thehindu.com/opinion/op-ed/the-long-steep-road-ahead-for-the-akali-dal/article65638310.ece
Disclaimer
This article belongs to the author and is independent of the views of the Centre.