

The 2019 election saw the highest percentage of women being elected to the Lok Sabha. However, this still constituted a mere 14% of the Members of Parliament, reflecting the massive gender gap that persists in the parliament. While there has been a steady increase in representation, this has been marginal and often inconsistent. At the state level, women’s representation is even worse, averaging at roughly 9%. This is despite reservations for women at the local level, and a high female voter turnout in recent years.
With the upcoming assembly elections in Gujarat and Himachal Pradesh, this column reflects on how representation has varied over time in both states, raising pertinent questions about the gender gap in politics. While analyzing the broad trends of female candidates and MLAs, the article also takes a closer look at the few women who have managed to sustain themselves in state politics. 
Figure 1
Women as Voters
Figure 1 depicts the gender gap in the voter turnout for Himachal Pradesh assembly elections. Here, male turnout refers to the percentage of men who voted, out of the total registered male voters (not as the percentage of all voters). The gap between women and men voters has gradually reversed from -17.08% in 1967 to an impressive +6.81% in 2012.1 In the last 5 assembly elections (1998-2017), women have had a higher turnout percentage than men, indicating a rise in their electoral participation. This trend is significant for the politics of the state, since women are known to have different policy preferences, as both voters and legislators. Political parties have recently sought to attract women voters through welfare schemes and campaign promises, recognising their distinct voting patterns. Even as legislators, women are more likely to address gender-specific issues and recruit other women into the political arena.
Figure 2
Figure 2 depicts the gender gap in the voter turnout for Gujarat assembly elections. The gap between women and men has reduced from -11.15% in 1962 to -3.44% in 2012. While male turnout has remained higher than female turnout, Gujarat has seen a slight increase in female voting and a higher woman voter ratio in recent years. 2017 witnessed a voter ratio of 924:1000, which marks a steady increase from 910:1000 in 2012. The rising female voters’ turnout in Gujarat and Himachal Pradesh suggest that women are actively participating in elections, but does it also herald an increase in female contestation and representation?
Women as Candidates and MLAs
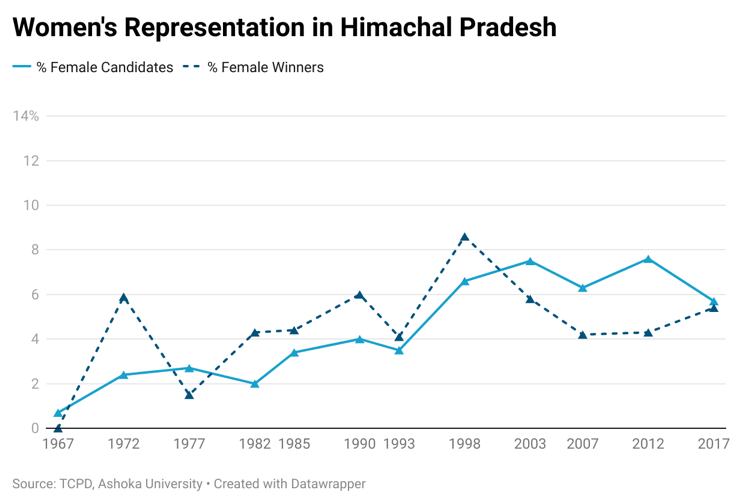
Figure 3 shows the marginal rise in female candidacy in Himachal Pradesh, from 2% in the 1970s to 6% in the 2000s. Given the small size of Himachal’s legislative assembly (currently at 68 seats), the number of female MLAs in the assembly has never exceeded 6. The percentage of female MLAs has shown no significant improvement since the 1960s, remaining consistently under 6% with the exception of 1998 (8.6%). The marginal rise in female candidacy has had little effect on representation in the past two decades, with the percentage of elected women falling below the percentage of contesting women. This negates the idea that female representation will increase as female nominations within major parties increase — but given the small size of the state assembly and negligible number of women participants in Himachal politics, there is not enough data to make this inference.
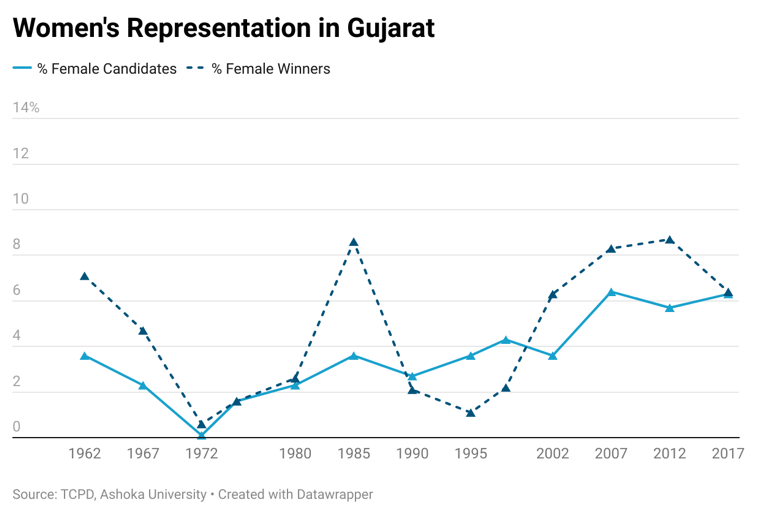
Figure 4 suggests that Gujarat has also had a similar rise in female candidacy over the few decades. The percentage of female candidates has increased from roughly 2% in the 1960’s and 1970’s, to an average of 6% in the past three elections. Once again however, the proportion of female MLAs have varied through time, remaining consistently below 10%. In both states, the proportional representation of women points towards the continued marginalization of women in state politics, despite a rise in women’s turnout and the introduction of local level reservations.
Conclusion
In both states, electoral contests have historically been bipolar, contested primarily between the Indian National Congress (INC) and the Bharatiya Janata Party (BJP). Himachal Pradesh has alternately elected the INC and the BJP in every election since 1985, while Gujarat has continuously been under BJP rule since 1998. The two national parties have dominated the political arena across the local, state and national levels. As a result, both parties have acquired a support base amongst a coalition of caste and ethnic groups. The parties have often nominated their candidates keeping caste-coalitions in mind. For example, both parties have increasingly sought to mobilize Other Backward Class (OBC) votes as part of their winning coalition in Gujarat, with the Patel, Koli and Kshatriya communities being central to their outreach. Similarly, Brahmins and Rajputs dominate the political arena in Himachal, finding high representation within both parties. Thus, with the rise of women’s participation, one would expect major political parties to recruit and nominate more women. Why is this not happening?
Even within the handful of women who are elected, only a select few are able to sustain themselves in the political arena. The “stable political class” refers to the group of candidates who have served more than two terms in office. Himachal and Gujarat only have 6 and 7 women respectively, who have been part of the stable political class. This number is extremely low and suggests that women continue to face different costs after entering the political realm. Amongst these 13 women, many are able to sustain themselves due to their elite background and their family networks. In Himachal, for example, Vidya Stokes is the longest serving female MLA who has served 7 terms. Her father-in-law was the renowned pioneer and social worker Satyananda Stokes. Similarly Asha Kumari, a 6 term MLA, belongs to the erstwhile royal family of Chamba. However, former Chief Minister Anandiben Mafatbhai Patel’s example proves that there are exceptions to this norm. The current Governor of Uttar Pradesh was once a schoolteacher, who rose through the ranks of the BJP to establish herself as a 4 time MLA in Gujarat and a career politician. Cases like hers highlight the potential for women to emerge as political representatives within the male-dominated space of party and parliament.
About the Author
Ayaan Sagar is an ASP student at Ashoka University, pursuing an advanced major in political science. He is currently writing an undergraduate thesis and has worked with TCPD for several projects.
Acknowledgements
I would like to thank Ananay Agarwal, Maleeha Fatimah & Poulomi Ghosh for their constant guidance and support.
References
- Ananay Agarwal, Neelesh Agrawal, Saloni Bhogale, Sudheendra Hangal, Francesca Refsum Jensenius, Mohit Kumar, Chinmay Narayan, Basim U Nissa, Priyamvada Trivedi, and Gilles Verniers. 2021. “TCPD Indian Elections Data v2.0″, Trivedi Centre for Political Data, Ashoka University.
- Masoodi, Ashwaq. “Only 9% of MLAs in India are women: Economic Survey” LiveMint. January 30, 2018
- Rai, Praveen. “Women’s Participation in Electoral Politics in India.” South Asia Research, Vol. 37(1), 2017, pp. 58–77
- Verma, Rahul & Ankita Barthwal. “How women voters are altering India’s electoral politics, in five charts.” LiveMint.com. March 8, 2021.
- Chattopadhyay, Raghabendra, and Esther Duflo. “Women as Policy Makers: Evidence from a Randomized Policy Experiment in India.” Econometrica, vol. 72, no. 5, 2004, pp. 1409–43. JSTOR, http://www.jstor.org/stable/3598894. Accessed 1 Nov. 2022.
- Nair, Avinash. “Gujarat: Woman voter ratio climbs to 924 — new high since last Lok Sabha polls” The Indian Express, February 6, 2019. https://indianexpress.com/elections/gujarat-woman-voter-ratio-climbs-to-924-new-high-since-last-lok-sabha-polls-5571104/.
- Nair, Avinash. “Gender skew in Gujarat electoral rolls: The younger the voters, the fewer the women” The Indian Express, October 13, 2017.
- Dave, Amit. “How Gujarat was won (and lost): 28 charts that explain the election results.” Scroll.in, December 9, 2017. https://scroll.in/article/862048/how-gujarat-was-won-and-lost-28-charts-that-explain-the-election-results
This article belongs to the author and is independent of the views of the Centre.