Background
The Indian Administrative Service is the Executive part of the State which serves primarily the function of implementing policies enacted by the legislature. It has been a part of the Indian State since the British era and is one of the main pillars of the Indian State. Composed of around 5000 officers, who are either recruited directly through competitive examinations known as the UPSC (Union Public Services Commission) Exam or promoted from State Civil Services, this administrative body is diverse in terms of the background of the people within its ranks. Given that administration by itself is a technocratic task, it is important to see what the educational background of these Officers are and what patterns emerge at different time periods.
Level of Education
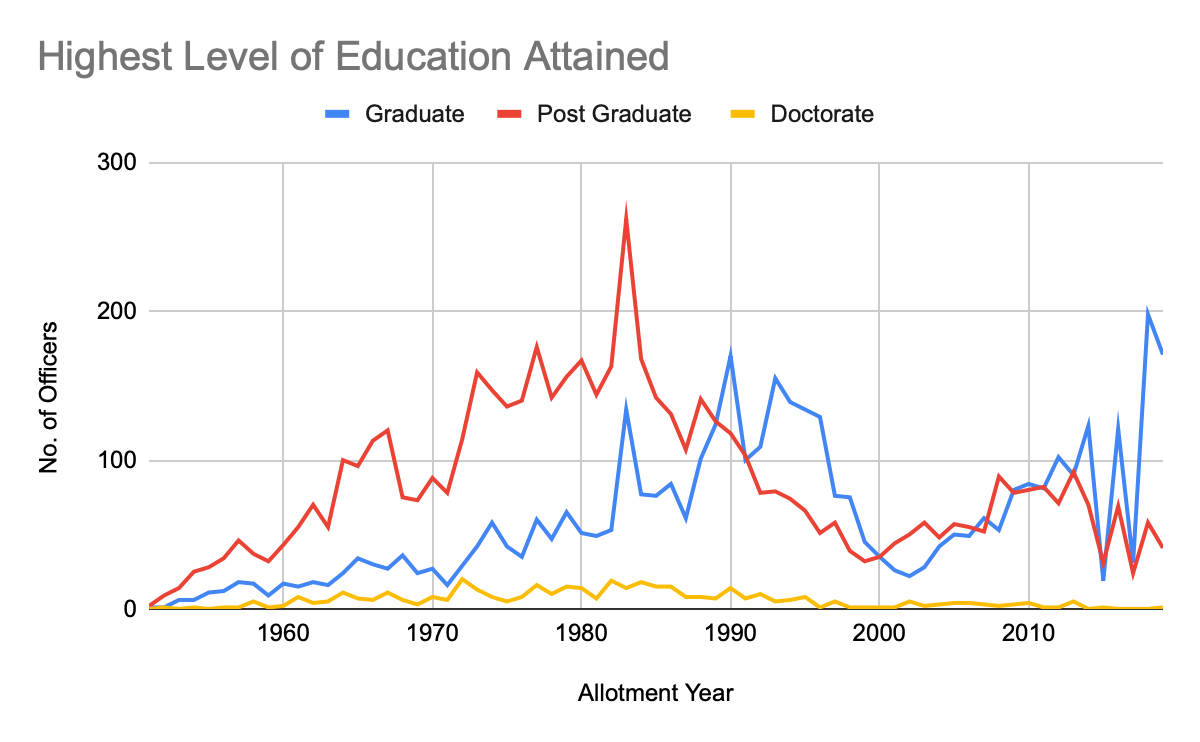
The number of years a candidate spends in higher education before joining the IAS has been decreasing according to the data analyzed for this article – the TCPD-IAS dataset which contains information on the IAS officers of India.
It can be seen that, since 1985, there is a declining trend in the number of officers who have attained a postgraduate degree or higher and similarly, there is an increase in the number of officers with a Graduate degree. One clear inflection point is 1990 when the number of graduates joining the ranks increased over the postgraduates for the first time in the history of the service. This trend has been fluctuating but remains more or less constant after the 1990s.
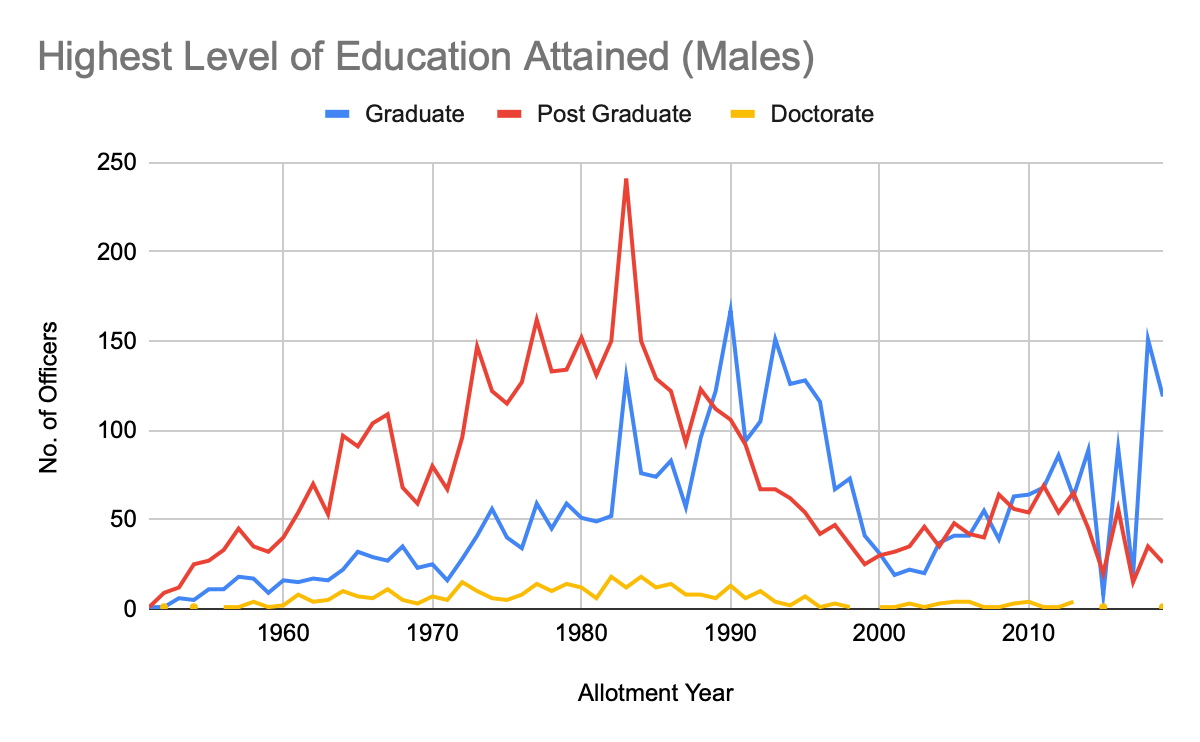
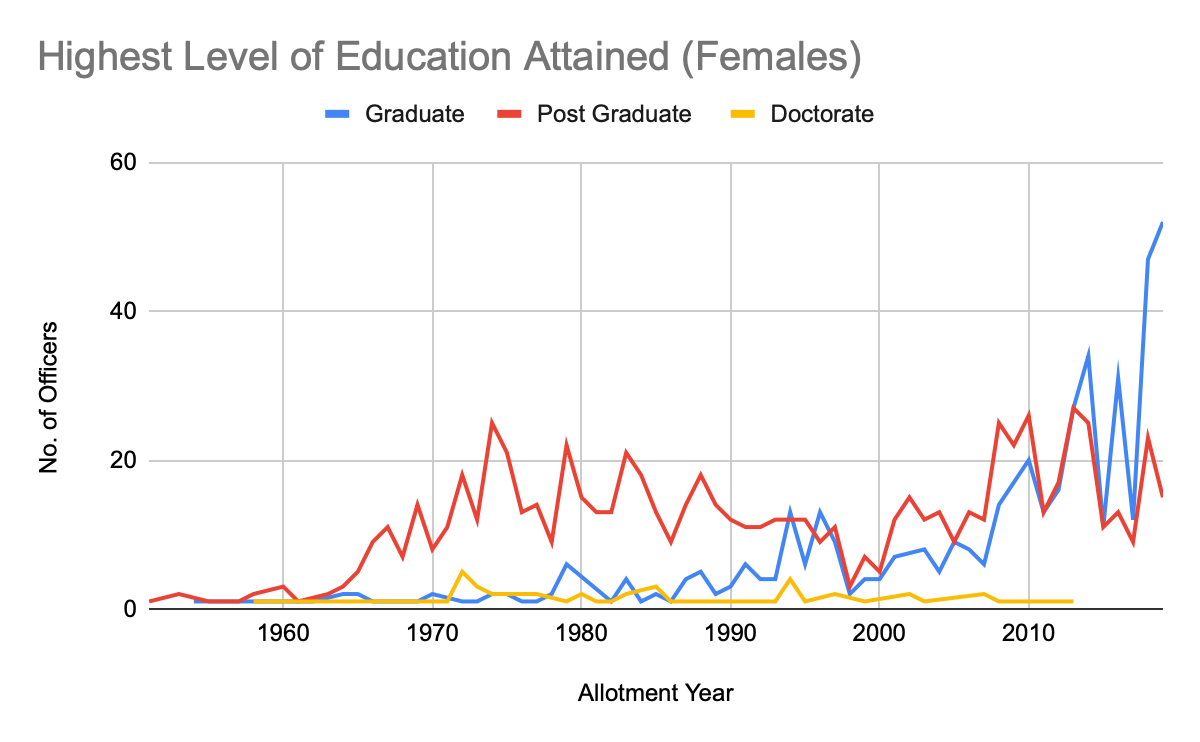
Breaking down this data in terms of gender, we notice overall similar trends for both men and women in terms of decrease in the number of years spent in education. However, for women, it is seen that they spend more time in higher education than men do before joining the service. This could reflect a higher barrier to entry in a service that is heavily male-dominated. One reason behind this trend could be the rise of IAS Coaching centers over the years which allow aspirants to focus directly on preparing for UPSC rather than college.
Age
This trend is also correlated with the average age of IAS officers (at the time of joining) decreasing to some extent over time — especially after the 1990s. A sharp decline is seen post 2010.

Field of Education
Another important issue to look at within educational background is the discipline that these officers have pursued. Given the generalized nature of the Civil Service, there are many functions across various departments that an IAS officer might be required to carry out. The question of expertise within the domain of the officer’s work has been brought up repeatedly in public discourse – especially within the context of ‘Lateral Entry’, which refers to the idea of recruiting industry ‘experts’ to join departments as IAS officers directly without the exam. As mentioned above, we can notice that the percentage of officers who enter the Service with a postgraduate degree or higher is reducing. However, now there is greater diversity in the disciplines/fields that these officers are coming from.
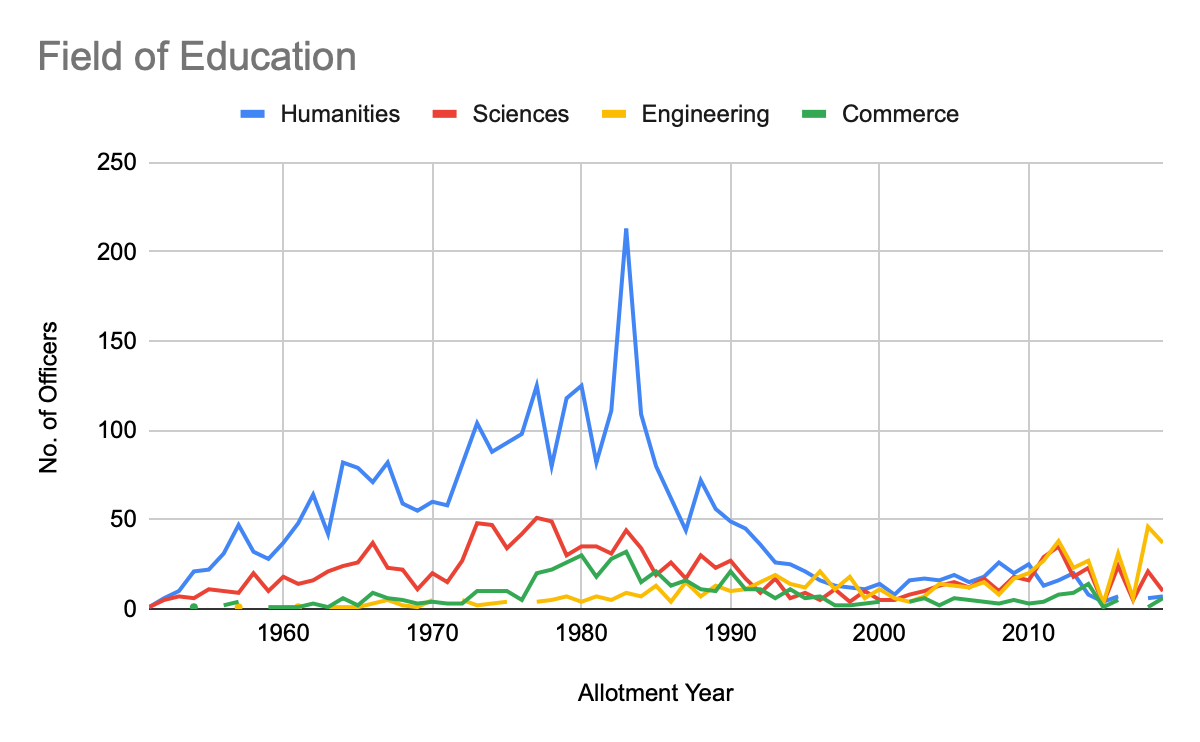
Till the 1980s, the discipline within Humanities and Social Sciences dominated the educational background of the IAS with Sciences coming in second. However, in recent years, especially post 1990s, there has been a convergence between these broad fields of study. More officers with a background in Engineering and Sciences related areas of study such as Mechanical Engineering, Physics, Medicine, etc. are joining the Service.
Between 1951-1999, Economics was the most common discipline along with other social science related subjects such as Political Science, Law, etc. However, between 2000-2019, this has changed drastically. As noticed from this table below, the percentage of officers from these disciplines has also reduced in the latter time period, suggesting more diversification.
| 1951-1999 | 2000-2019 | ||
| Discipline | % of Officers | Discipline | % of Officers |
| Economics | 11.52% | Electrical Engg. | 3.19% |
| Political Sc. | 6.84% | Medicine | 3.00% |
| Physics | 5.56% | Economics | 2.13% |
| History | 5.35% | Computer Sc | 2.09% |
| English | 4.60% | Mech.engg. | 1.82% |
| Law | 3.77% | Civil Engg | 1.63% |
| English Lit | 2.87% | Electronics | 1.61% |
| Mathematics | 2.54% | Law | 1.45% |
| Commerce | 2.34% | History | 1.41% |
| Public Admn | 2.29% | Political Sc. | 1.41% |
For women too, this shift is quite visible but it has not been very dramatic overall – reflecting the general problem of women representation in STEM.
| 1951-1999 | 2000-2019 | ||
| Discipline | % of Officers | Discipline | % of Officers |
| English Lit | 9.94% | Economics | 4.84% |
| Political Sc. | 9.49% | Medicine | 3.60% |
| Economics | 7.98% | Political Sc. | 2.88% |
| English | 7.83% | Computer Sc | 2.57% |
| History | 6.33% | Law | 2.37% |
| Sociology | 4.37% | Electrical Engg. | 1.85% |
| Psychology | 2.86% | Commerce | 1.54% |
| Public Admn | 2.86% | History | 1.54% |
| Law | 2.26% | Civil Engg | 1.44% |
| Philosophy | 1.81% | Electronics and Communication | 1.13% |
Cadre and Education
The Cadres which the IAS officers become a part of are decided based on their place of domicile and preferences provided. Usually, there is a 50-50 split between in-state and out-state officers for any particular Cadre. Is there any significant variation within the education levels of IAS officers in these cadres? To answer this, a variable called ed-level has been created which takes the weighted average of the education level by using the following weights and formula-
Weights
| Graduate | 1 |
| Post Graduate | 2 |
| Doctorate | 3 |
Formula –
Average of Education Level = (No. of Graduates*1 + No. of PostGraduates*2 + No. of Doctorates*3)/(No. Of Graduates + No. of PostGraduates + No. of Doctorates)
Using this, we arrive at the following graph which represents the weighted average of education level for all the Cadres.

Clearly, there is no significant variance in these numbers with the overall average being 1.42. Tripura, while it has the highest score overall, also has very few IAS officers altogether. Since this index does not take into account the number of IAS officers in the Cadre, we can say that the differences overall might be even more minimal.
Conclusion
Although the job of an officer requires multiple skills and experience, education is also an important factor given India’s separation of powers where the Executive is responsible for technical expertise. They also represent demographic changes in the composition of IAS with preparation for the exams becoming more and more accessible. Hence, given these developments, it is important to ask how these trends impact effectiveness and whether there should be a greater emphasis on specialization requirements for the IAS.
NOTES ON METHODOLOGY AND LIMITATIONS
- Out of the 13570 total entries, educational information was not available for around 4000 entries. This is a major limitation of the dataset as it takes away a substantial portion of the analyzable sample. Moreover, this was concentrated between the years 2000-2020 where about 45% of the entries did not have information regarding education. Comparing this to about 15% missing values for the time period of 1981-99, this would explain some of the skewness in the graph – especially the great dips and spikes around 2010.
| yr | total_na | total_allotment | perc_na |
| 1981-99 | 753 | 4895 | 0.1538304392 |
| 2000-19 | 2142 | 4833 | 0.4432029795 |
- The age_at_joining variable was created with formula (Date of Joining – Date of Birth) however, again, in the same time period, between 2000-2019, there are a lot of missing values in the dataset which have caused the unusual spike in 2010 – suggesting that the average age in that year was around 50.
- Field of Education has been drawn from the variable ‘Last_Education_Subject’. However, this list was not standardized and there were about 433 unique entries. Since most of the subjects mentioned under this had less than 3 corresponding entries, I created a new list to get a representative idea of the top disciplines. The division of the top 20 disciplines (from the entire list based on frequency) was done into 4 broad categories – Humanities, Sciences, Engineering, Commerce. The sub-disciplines that have been included are as follows –
| Humanities | “Economics”, “Political Science”, “History”, “English Lit”, “English”, “Sociology”, “Philosophy”, “Psychology”,”Law”, “Hindi”, “Sanskrit”, “Social Sciences” |
| Sciences | “Physics”, “Chemistry”, “Biology”, “Mathematics”, “Medicine”, “Botany”, “Computer Sc”, “Agriculture”, “Statistics” |
| Engineering | “Electrical Engg.”, “Mech.engg.”, “Chemical Engg”, “Electronics”, “Engineering”, “Information Technology”, “Mechanical”, “Indl Engg.” |
| Commerce | “Commerce”, “Management”, “Finance”, “Business Admn.” |
Of course, this list is not complete but it is representative of the overall distribution.
About the Author
Varun Agarwal was a research intern at TCPD. He is a third year student pursuing B.A. (Hons.) Philosophy, Politics and Economics (PPE) at Ashoka University.
Acknowledgements
I thank Poulomi Ghosh and Dipanita Malik from the Trivedi Centre for Political Data for their useful feedback and suggestions.
References
“TCPD Indian Administrative Service Officers Dataset (TCPD-IAS), 1951-2020”, Trivedi Centre for Political Data, Ashoka University.
Sharma, Kritika. “Inside India’s giant IAS coaching factories: Hope, hype and big money.” ThePrint, August 6, 2018. https://theprint.in/india/governance/the-inside-story-of-indias-giant-ias-coaching-factories-hope-hype-and-big-money/93703/
Disclaimer
This article belongs to the author and is independent of the views of the Centre.