
COURSE OBJECTIVE
Political scientists and other researchers in the social sciences must often build and analyze data sets in the course of their work, which requires the use of tools, methods and processes they are usually not familiar with. This week-long summer school aims to introduce students and scholars to the techniques and practices required to build datasets for social science research (politics in particular) through classroom sessions and practical modules taught jointly by computer scientists and social scientists.Under the mentorship of the instructors, participants will identify and work on their own mini-project during the summer school. They will work in teams to carry out data gathering, cleaning, analysis, visualization, etc., and learn to apply the tools and practices discussed in the classroom sessions. By the end of the week, participants are expected to have built a cohesive dataset and gained skills in working with data for social science research.The summer school will cover various aspects of data-based research, including data gathering, cleaning, management, analysis, and visualization. Working with map-based data and the challenges of combining quantitative and qualitative data will also be discussed.
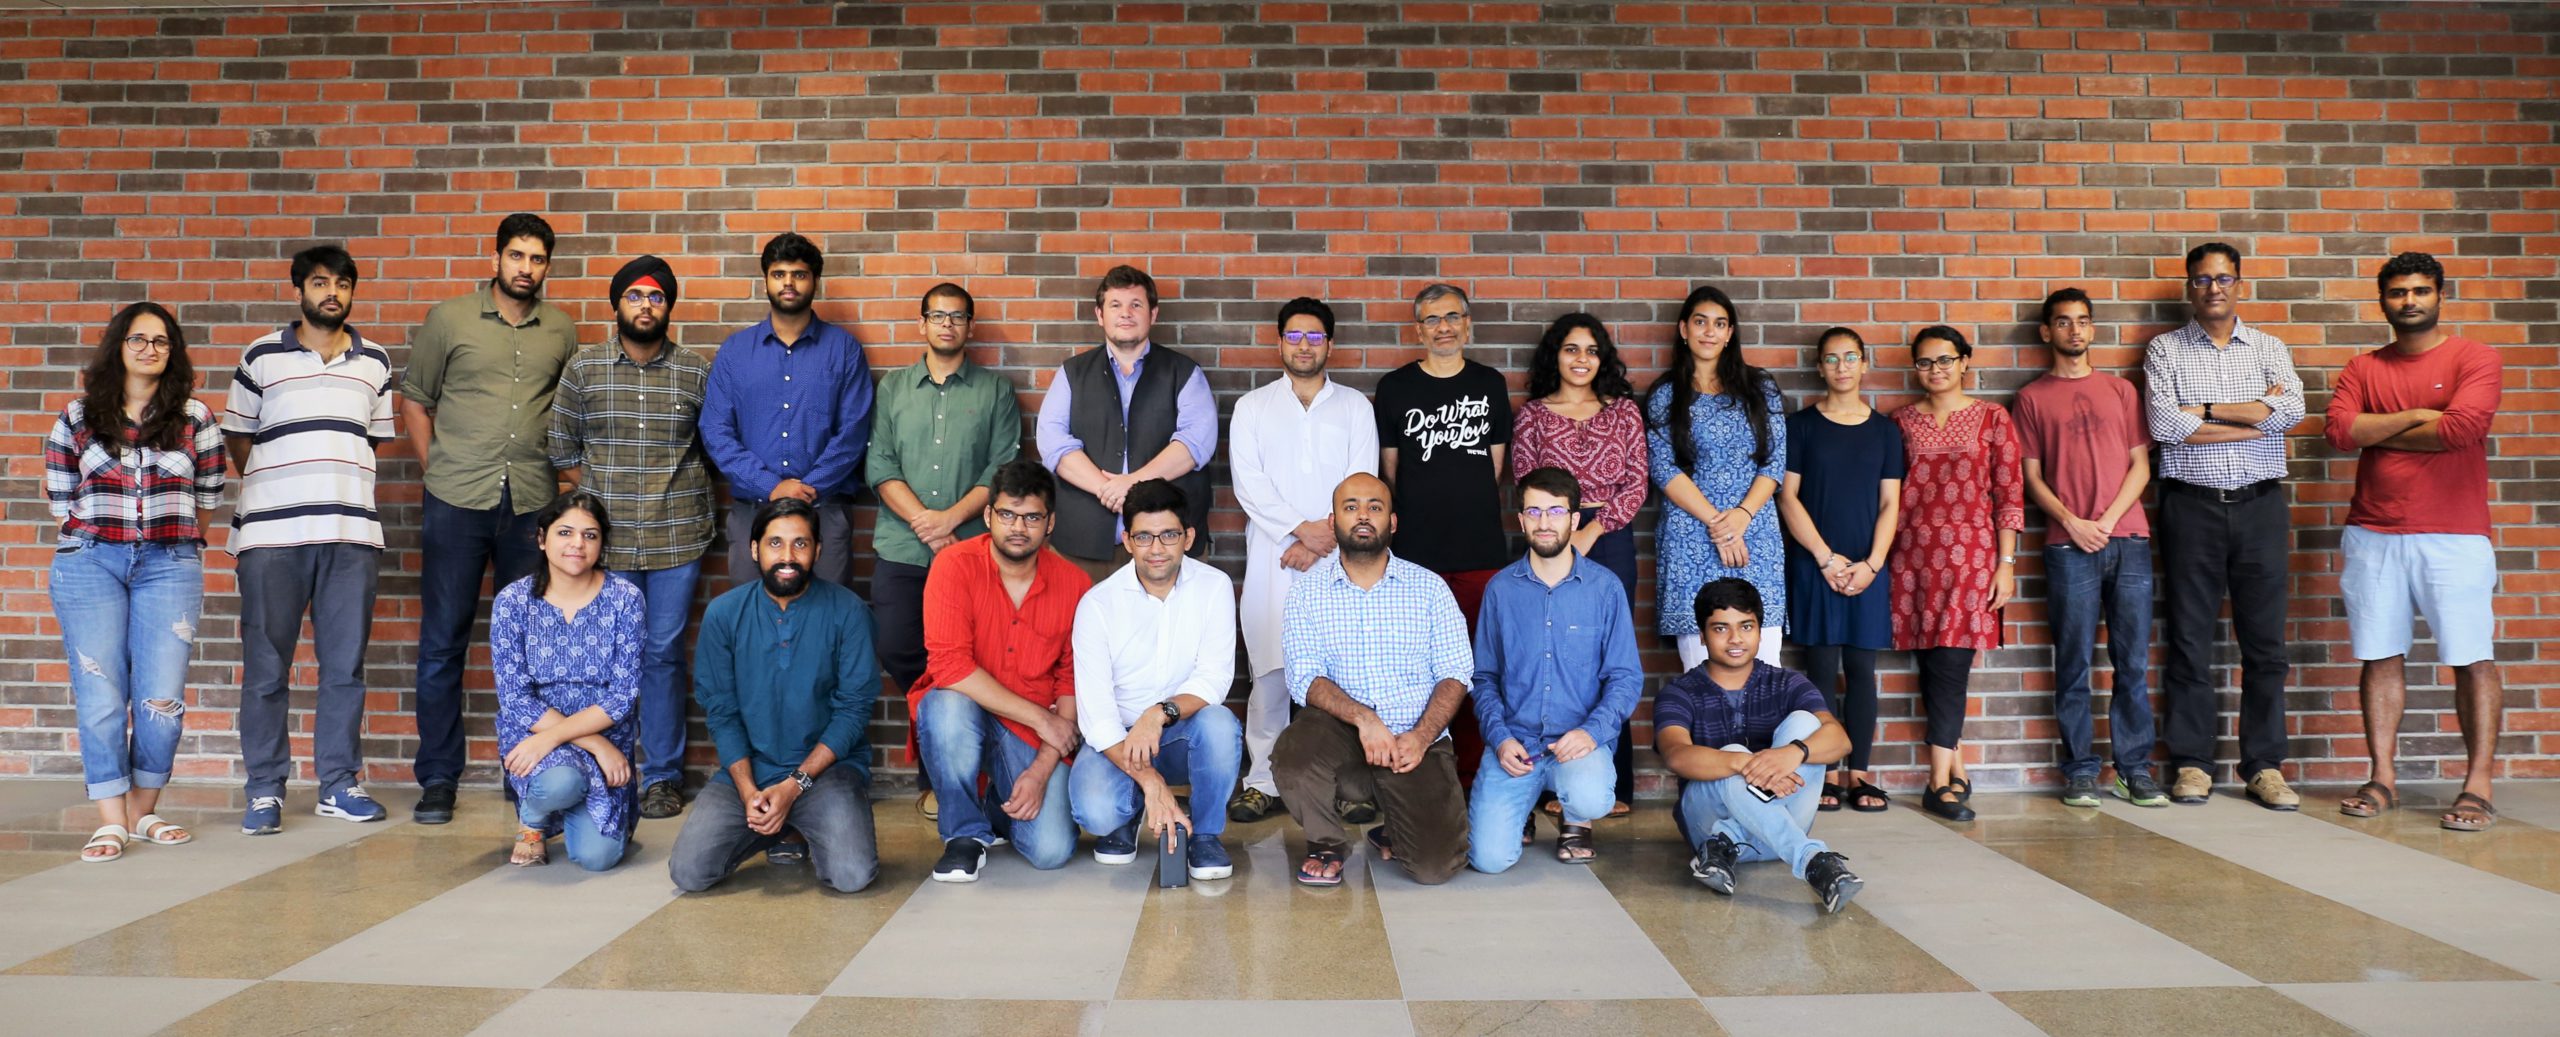
INSTRUCTORS
Gilles Verniers is a professor of political science at Ashoka University, and co-director of the Trivedi center for political data. His interests span a range of issues in the politics of South Asia, and he has published several research and press articles about these topics.
Mohit Kumar is research engineer and data scientist at the Trivedi Center for Political Data. He has a master’s degree in computer science and has been a developer for open source for Geospatial foundation (OSGeo).
Neelanjan Sircar is a Senior Fellow at the Centre for Policy Research in New Delhi. He is also a Non-Resident Fellow at the Center for the Advanced Study of India at the University of Pennsylvania. His research interests include Indian political economy and comparative political behavior with an eye to Bayesian statistics, causal inference, social network analysis, and game theory.
Priyamvada Trivedi finished her PhD in Political Science from the University of Michigan in May 2018 and has joined TCPD as its Associate Director. She completed her BS in Electrical Engineering from Purdue in 2009 after which she spent 3 years in the Sociology Department at the University of Notre Dame before moving to Michigan in 2012. She is interested in understanding the dynamics of political and social change using different forms of evidence such as government sources to newspapers to NGO reports and survey data along with learning and applying both qualitative and quantitative methods.
Rajkamal Singh is a Ph.D. candidate in political science at UC, Santa Barbara. He was a Research Fellow at the Trivedi Center for Political Data, where he managed several projects, including the development of a comprehensive dataset for Indian elections. He has an undergraduate degree in engineering.
Sudheendra Hangal is a professor of practice in Computer Science at Ashoka University, where he also co-directs the Trivedi Center for Political Data. His research spans the areas of human-computer interaction, social data analysis and personal digital archives.
Venkatesh Rajamanickam is a Professor at Industrial Design Centre, IIT Bombay with interest in Human-Computer Interface Design, Data Visualization, Technology and Learning, Design History and Affordable Housing.
PROGRAM AND RESOURCES
Introduction and kickoff – Sudheendra Hangal and Basim
Open data and data formats – Sudheendra Hangal
Methods for building data sets and introduction to data bases – Neelanjan Sircar
Overview of data sources on Indian politics – Gilles Verniers
Technical Module I: Data scraping – Mohit Kumar
Work on mini-project – Priyamvada Trivedi
Technical Module II – Introduction to parsing and analyzing data – Mohit Kumar and Sudheendra Hangal
How to build maps, Session I – Mohit Kumar
How to build maps, Session II – Mohit Kumar
Data visualization I – Venkatesh Rajamanickam
Data visualization II – Venkatesh Rajamanickam
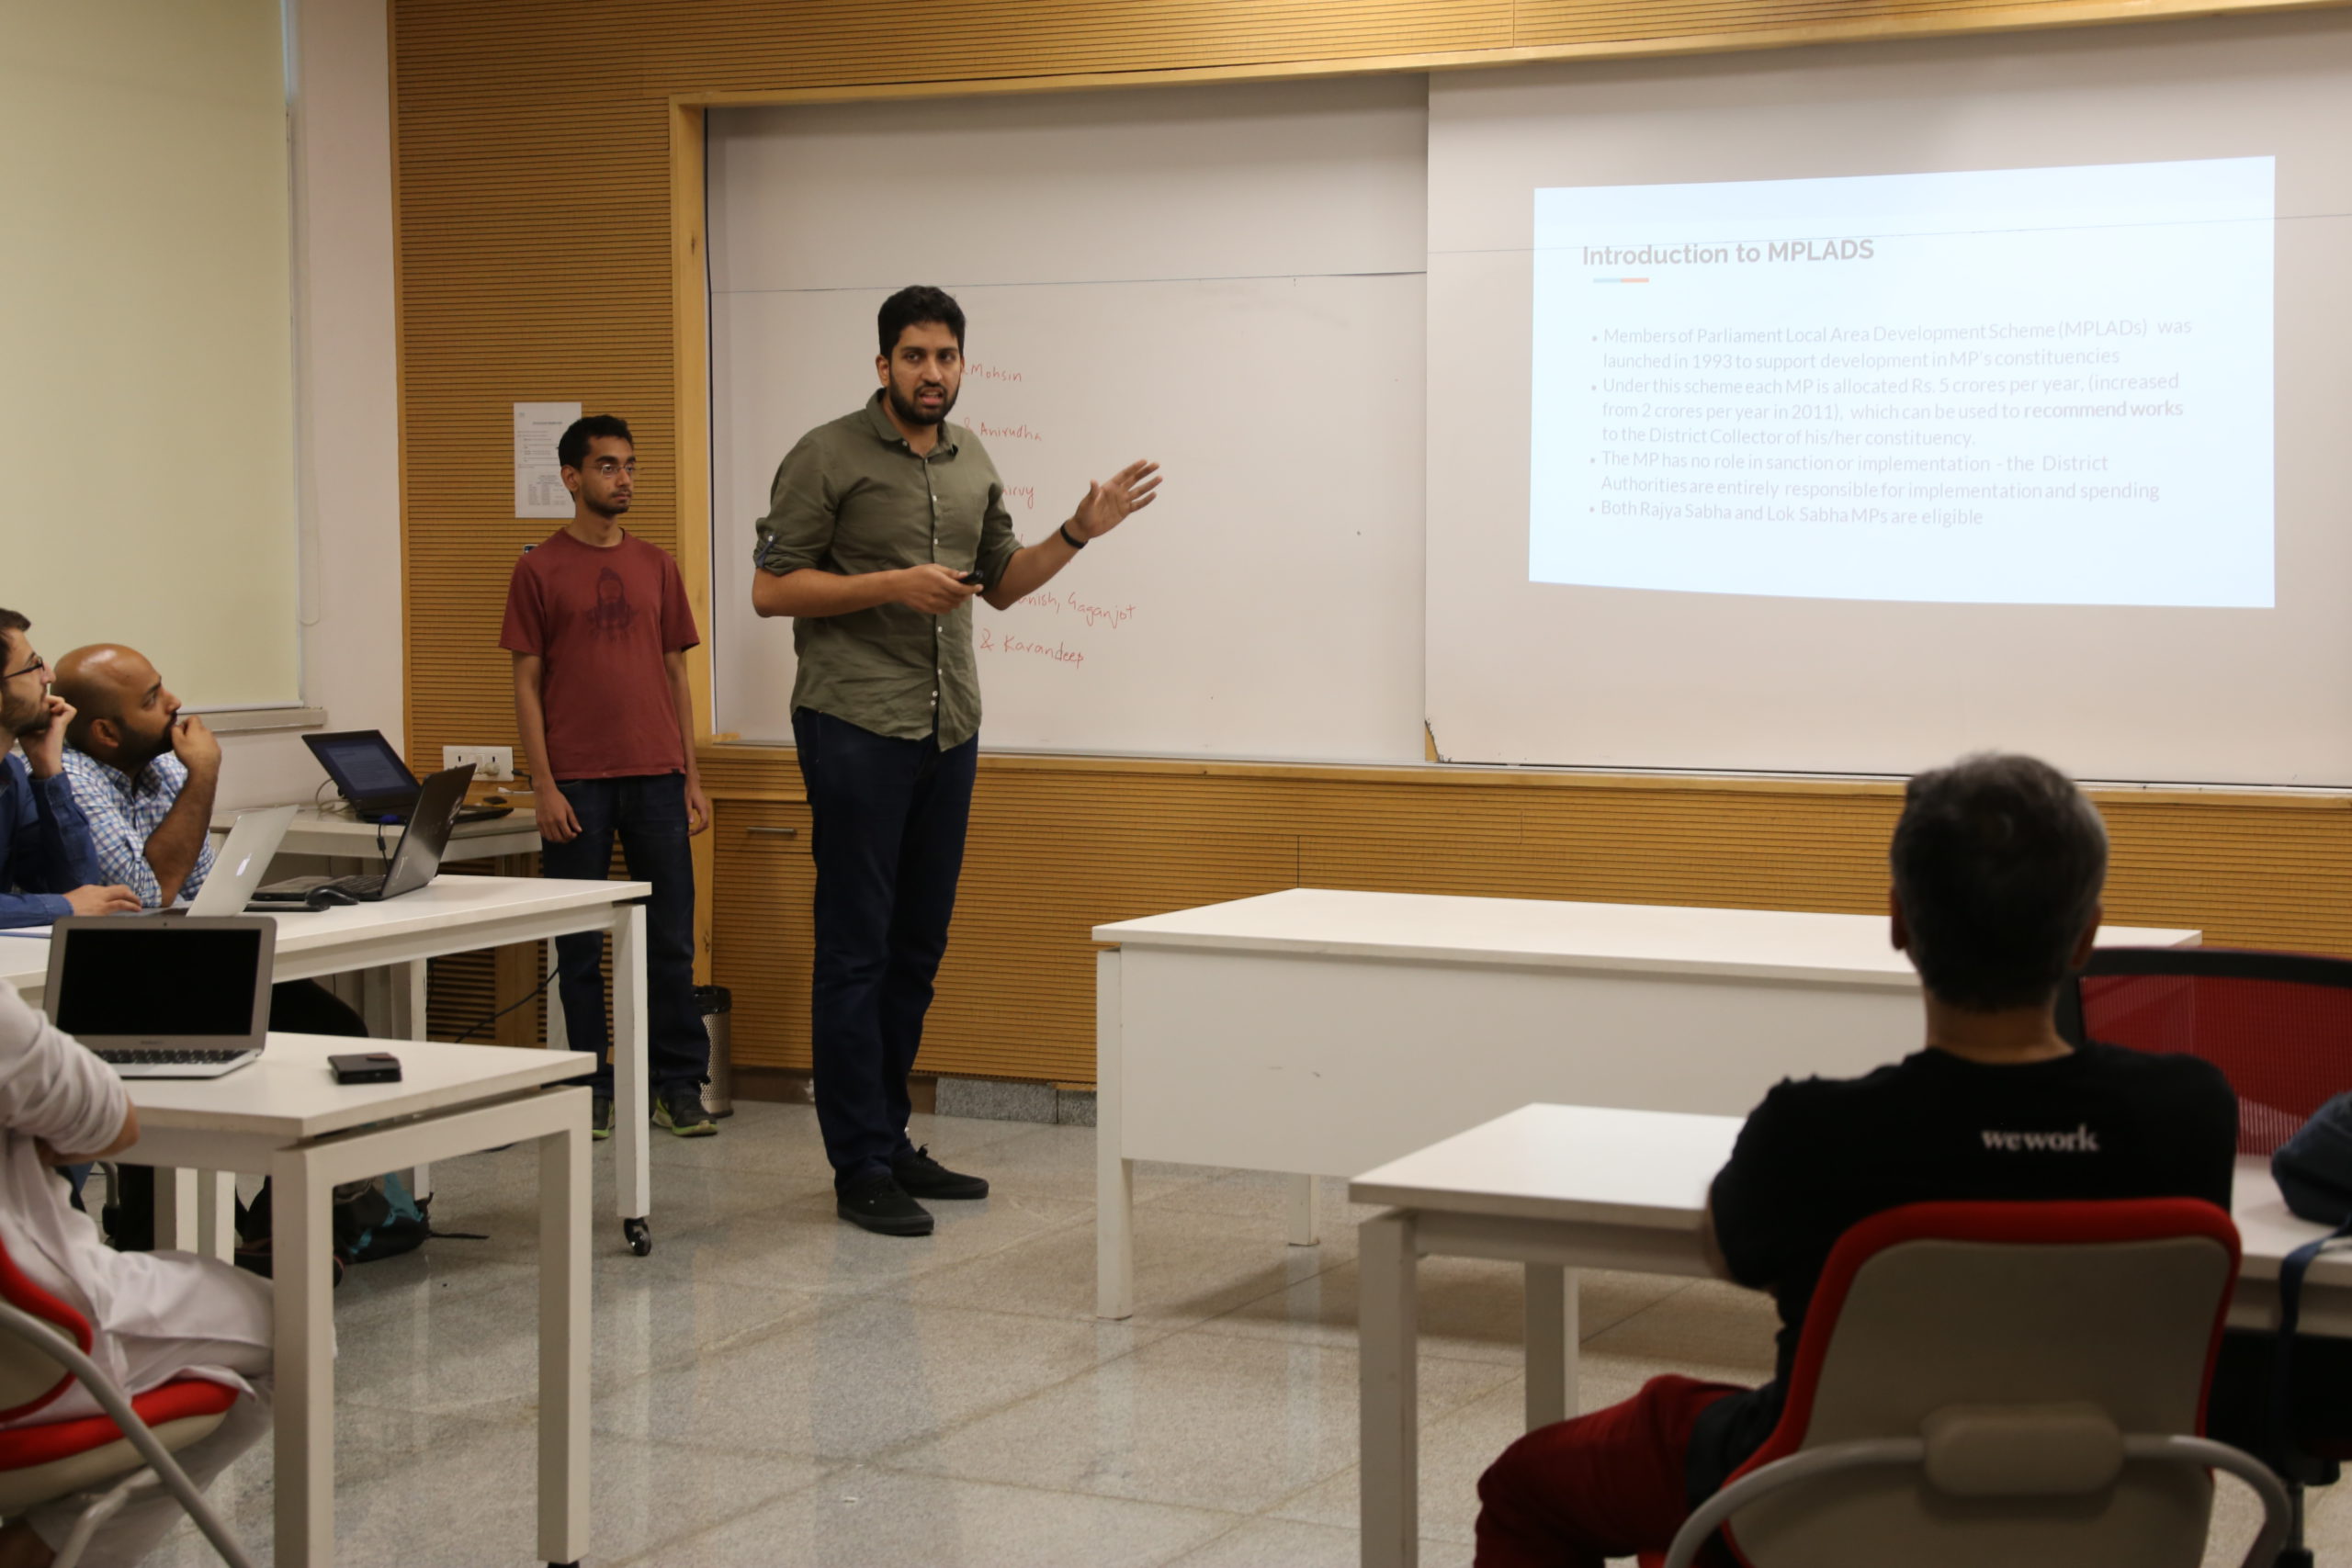
Mixing quantitative and qualitative data – Gilles Verniers and Rajkamal Singh